Showing posts with label neuroimaging. Show all posts
Thursday, January 7, 2016
Mumford & Stats: Up Your Neuroscience Game
Jeanette Mumford, furious at the lack of accessible tutorials on neuroimaging statistics, has created her own Tumblr to distribute her knowledge to the masses.
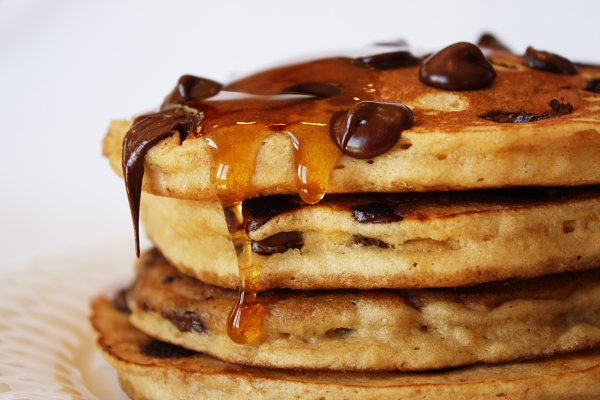
I find examples like these heartening; researchers and statisticians providing help to newcomers and veterans of all stripes. Listservs, while useful, often suffer from poorly worded questions, opaque responses, and overspecificity - the issues are individual, and so are the answers, which go together like highly specific shapes of toast in a specialized toaster.* Tutorials like Mumford's are more like pancake batter spread out over a griddle, covering a wide area and seeping into the drip pans of understanding, while being sprinkled with chocolate chips of insight, lightly buttered with good humor, and drizzled with the maple syrup of kindness.
I also find tutorials like these useful because - let's admit it - we're all slightly stupid when it comes to statistics. Have you ever tried explaining it to your dad, and ended up feeling like a fool? Clearly, we need all the help we can get. If you've ever had to doublecheck why, for example, a t-test works the way it does, or brush up on how contrast weights are made, this website is for you. (People who never had to suffer to understand statistics, on the other hand, just like people who don't have any problems writing, are disgusting and should be avoided.)
Jeanette has thirty-two videos covering the basics of statistics and their application to neuroimaging data, a compression of one of her semester-long fMRI data courses which should be required viewing for any neophyte. More recent postings report on developments and concerns in neuroimaging methods, such as collinearity, orthogonalization, nonparametric thresholding, and whether you should date fellow graduate students in your cohort. (I actually haven't read all of the posts that closely, but I'm assuming that something that important is probably in there somewhere.) And, unlike myself, she doesn't make false promises and she posts regularly; you get to stay current on what's hot, what's not, and, possibly, you can begin to make sense of those knotty methods sections. At least you'll begin to make some sense of the gibberish your advisor mutters in your general direction the next time he wants you to do a new analysis on the default pancake network - the network of regions that is activated in response to a contrast of pancakes versus waffles, since they are matched on everything but texture.**
It is efforts such as this that make the universe of neuroimaging, if not less complex, at least more comprehensible, less bewildering; more approachable, less terrifying. And any effort like that deserves its due measure of praise and pancakes.
*It was only after writing this that I realized you put bread into a toaster - toast is what comes out - but I decided to just own it.
**Do not steal this study idea from me.
Labels:
breakfast,
fMRI,
jeanette mumford,
neuroimaging,
pancakes,
statistics
Friday, July 31, 2015
Converting T-Maps to Z-Maps
Mankind craves unity - the peace that comes with knowing that everyone thinks and feels the same. Religious, political, social endeavors have all been directed toward this same end; that all men have the same worldview, the same Weltanschauung. Petty squabbles about things such as guns and abortion matter little when compared to the aim of these architects. See, for example, the deep penetration into our bloodstream by words such as equality, lifestyle, value - words of tremendous import, triggering automatic and powerful reactions without our quite knowing why, and with only a dim awareness of where these words came from. That we use and respond to them constantly is one of the most astounding triumphs of modern times; that we could even judge whether this is a good or bad thing has already been rendered moot. Best not to try.
It is only fitting, therefore, that we as neuroimagers all "get on the same page" and learn "the right way to do things," and, when possible, make "air quotes." This is another way of saying that this blog is an undisguised attempt to dominate the thoughts and soul of every neuroimager - in short, to ensure unity. And I can think of no greater emblem of unity than the normal distribution, also known as the Z-distribution - the end, the omega, the seal of all distributions. The most vicious of arguments, the most controversial of ideas are quickly resolved by appeal to this monolith; it towers over all research questions like a baleful phallus.
There will be no end to bantering about whether to abolish the arbitrary nature of p less than 0.05, but the bantering will be just that. The standard exists for a reason - it is clear, simple, understood by nearly everyone involved, and is as good a standard as any. A multitude of standards, a deviation from what has become so steeped in tradition, would be chaos, mayhem, a catastrophe. Again, best not to try.
I wish to clear away your childish notions that the Z-distribution is unfair or silly. On the contrary, it will dominate your research life until the day you die. Best to get along with it. The following SPM code will allow you to do just that - convert any output to the normal distribution, so that your results can be understood by anyone. Even by those who disagree, or wish to disagree, with the nature of this thing, will be forced to accept it. A shared Weltanschauung is a powerful thing. The most powerful.
The following Matlab snippet was created by my adviser, Josh Brown. I take no credit for it, but I use it frequently, and believe others will get some use out of it. The calculators in each of the major statistical packages - SPM, AFNI, FSL - all do the same thing, and this is merely one application of it. The more one gets used to applying these transformations to achieve a desired result, the more intuitive it becomes to work with the data at any stage - registration, normalization, statistics, all.
%
% Usage: convert_spm_stat(conversion, infile, outfile, dof)
%
% This script uses a template .mat batch script object to
% convert an SPM (e.g. SPMT_0001.hdr,img) to a different statistical rep.
% (Requires matlab stats toolbox)
%
% Args:
% conversion -- one of 'TtoZ', 'ZtoT', '-log10PtoZ', 'Zto-log10P',
% 'PtoZ', 'ZtoP'
% infile -- input file stem (may include full path)
% outfile -- output file stem (may include full pasth)
% dof -- degrees of freedom
%
% Created by: Josh Brown
% Modification date: Aug. 3, 2007
% Modified: 8/21/2009 Adam Krawitz - Added '-log10PtoZ' and 'Zto-log10P'
% Modified: 2/10/2010 Adam Krawitz - Added 'PtoZ' and 'ZtoP'
function completed=convert_spm_stat(conversion, infile, outfile, dof)
old_dir = cd();
if strcmp(conversion,'TtoZ')
expval = ['norminv(tcdf(i1,' num2str(dof) '),0,1)'];
elseif strcmp(conversion,'ZtoT')
expval = ['tinv(normcdf(i1,0,1),' num2str(dof) ')'];
elseif strcmp(conversion,'-log10PtoZ')
expval = 'norminv(1-10.^(-i1),0,1)';
elseif strcmp(conversion,'Zto-log10P')
expval = '-log10(1-normcdf(i1,0,1))';
elseif strcmp(conversion,'PtoZ')
expval = 'norminv(1-i1,0,1)';
elseif strcmp(conversion,'ZtoP')
expval = '1-normcdf(i1,0,1)';
else
disp(['Conversion "' conversion '" unrecognized']);
return;
end
if isempty(outfile)
outfile = [infile '_' conversion];
end
if strcmp(conversion,'ZtoT')
expval = ['tinv(normcdf(i1,0,1),' num2str(dof) ')'];
elseif strcmp(conversion,'-log10PtoZ')
expval = 'norminv(1-10.^(-i1),0,1)';
end
%%% Now load into template and run
jobs{1}.util{1}.imcalc.input{1}=[infile '.img,1'];
jobs{1}.util{1}.imcalc.output=[outfile '.img'];
jobs{1}.util{1}.imcalc.expression=expval;
% run it:
spm_jobman('run', jobs);
cd(old_dir)
disp(['Conversion ' conversion ' complete.']);
completed = 1;
Assuming you have a T-map generated by SPM, and 25 subjects that went into the analysis, a sample command might be:
convert_spm_stat('TtoZ', 'spmT_0001', 'spmZ_0001', '24')
Note that the last argument is degrees of freedom, or N-1.
It is only fitting, therefore, that we as neuroimagers all "get on the same page" and learn "the right way to do things," and, when possible, make "air quotes." This is another way of saying that this blog is an undisguised attempt to dominate the thoughts and soul of every neuroimager - in short, to ensure unity. And I can think of no greater emblem of unity than the normal distribution, also known as the Z-distribution - the end, the omega, the seal of all distributions. The most vicious of arguments, the most controversial of ideas are quickly resolved by appeal to this monolith; it towers over all research questions like a baleful phallus.
There will be no end to bantering about whether to abolish the arbitrary nature of p less than 0.05, but the bantering will be just that. The standard exists for a reason - it is clear, simple, understood by nearly everyone involved, and is as good a standard as any. A multitude of standards, a deviation from what has become so steeped in tradition, would be chaos, mayhem, a catastrophe. Again, best not to try.
I wish to clear away your childish notions that the Z-distribution is unfair or silly. On the contrary, it will dominate your research life until the day you die. Best to get along with it. The following SPM code will allow you to do just that - convert any output to the normal distribution, so that your results can be understood by anyone. Even by those who disagree, or wish to disagree, with the nature of this thing, will be forced to accept it. A shared Weltanschauung is a powerful thing. The most powerful.
=============
The following Matlab snippet was created by my adviser, Josh Brown. I take no credit for it, but I use it frequently, and believe others will get some use out of it. The calculators in each of the major statistical packages - SPM, AFNI, FSL - all do the same thing, and this is merely one application of it. The more one gets used to applying these transformations to achieve a desired result, the more intuitive it becomes to work with the data at any stage - registration, normalization, statistics, all.
%
% Usage: convert_spm_stat(conversion, infile, outfile, dof)
%
% This script uses a template .mat batch script object to
% convert an SPM (e.g. SPMT_0001.hdr,img) to a different statistical rep.
% (Requires matlab stats toolbox)
%
% Args:
% conversion -- one of 'TtoZ', 'ZtoT', '-log10PtoZ', 'Zto-log10P',
% 'PtoZ', 'ZtoP'
% infile -- input file stem (may include full path)
% outfile -- output file stem (may include full pasth)
% dof -- degrees of freedom
%
% Created by: Josh Brown
% Modification date: Aug. 3, 2007
% Modified: 8/21/2009 Adam Krawitz - Added '-log10PtoZ' and 'Zto-log10P'
% Modified: 2/10/2010 Adam Krawitz - Added 'PtoZ' and 'ZtoP'
function completed=convert_spm_stat(conversion, infile, outfile, dof)
old_dir = cd();
if strcmp(conversion,'TtoZ')
expval = ['norminv(tcdf(i1,' num2str(dof) '),0,1)'];
elseif strcmp(conversion,'ZtoT')
expval = ['tinv(normcdf(i1,0,1),' num2str(dof) ')'];
elseif strcmp(conversion,'-log10PtoZ')
expval = 'norminv(1-10.^(-i1),0,1)';
elseif strcmp(conversion,'Zto-log10P')
expval = '-log10(1-normcdf(i1,0,1))';
elseif strcmp(conversion,'PtoZ')
expval = 'norminv(1-i1,0,1)';
elseif strcmp(conversion,'ZtoP')
expval = '1-normcdf(i1,0,1)';
else
disp(['Conversion "' conversion '" unrecognized']);
return;
end
if isempty(outfile)
outfile = [infile '_' conversion];
end
if strcmp(conversion,'ZtoT')
expval = ['tinv(normcdf(i1,0,1),' num2str(dof) ')'];
elseif strcmp(conversion,'-log10PtoZ')
expval = 'norminv(1-10.^(-i1),0,1)';
end
%%% Now load into template and run
jobs{1}.util{1}.imcalc.input{1}=[infile '.img,1'];
jobs{1}.util{1}.imcalc.output=[outfile '.img'];
jobs{1}.util{1}.imcalc.expression=expval;
% run it:
spm_jobman('run', jobs);
cd(old_dir)
disp(['Conversion ' conversion ' complete.']);
completed = 1;
Assuming you have a T-map generated by SPM, and 25 subjects that went into the analysis, a sample command might be:
convert_spm_stat('TtoZ', 'spmT_0001', 'spmZ_0001', '24')
Note that the last argument is degrees of freedom, or N-1.
Labels:
code,
conversion,
Matlab,
neuroimaging,
SPM,
t-maps,
z-maps
Friday, April 17, 2015
Slice Analysis of FMRI Data with SPM
Slice analysis is a simple procedure - first you take a jar of peanut butter and a jar of Nutella, and then use a spoon to take some Nutella and then use the same spoon to mix it with the peanut butter. Eat and repeat until you go into insulin shock, and then...
No, wait! I was describing my midnight snack. The actual slice analysis method, although less delicious, is infinitely more helpful in determining regional dissociations of activity, as well as avoiding diabetes. (Although who says they can't both be done at the same time?)
The first step is to extract contrast estimates for each slice from a region of interest (ROI, also pronounced "ROY") and then average across all the voxels in that slice for the subject. Of course, there is no way you would be able to do this step on your own, so we need to copy someone else's code from the Internet and adapt it to our needs; one of John Ashburner's code snippets (#23, found here) is a good template to start with. Here is my adaptation:
rootdir = '/data/drill/space10/PainStudy/fmri/'; %Change these to reflect your directory structure
glmdir = '/RESULTS/model_RTreg/'; %Path to SPM.mat and mask files
subjects = [202:209 211:215 217 219 220:222 224:227 229 230 232 233];
%subjects = 202:203;
Conditions.names = {'stroopSurpriseConStats', 'painSurpriseConStats'}; %Replace with your own conditions
Masks = {'stroopSurpriseMask.img', 'painSurpriseMask.img'}; %Replace with your own masks; should be the product of a binary ROI multiplied by your contrast of interest
Conditions.Contrasts = {'', ''};
ConStats = [];
Condition1 = [];
Condition2 = [];
for i=subjects
cd([rootdir num2str(i) glmdir])
outputPath = [rootdir num2str(i) glmdir]; %Should contain both SPM.mat file and mask files
for maskIdx = 1:length(Masks)
P = [outputPath Masks{(maskIdx)}];
V=spm_vol(P);
tmp2 = [];
[x,y,z] = ndgrid(1:V.dim(1),1:V.dim(2),0);
for i=1:V.dim(3),
z = z + 1;
tmp = spm_sample_vol(V,x,y,z,0);
msk = find(tmp~=0 & isfinite(tmp));
if ~isempty(msk),
tmp = tmp(msk);
xyz1=[x(msk)'; y(msk)'; z(msk)'; ones(1,length(msk))];
xyzt=V.mat(1:3,:)*xyz1;
for j=1:length(tmp),
tmp2 = [tmp2; xyzt(1,j), xyzt(2,j), xyzt(3,j), tmp(j)];
end;
end;
end;
xyzStats = sortrows(tmp2,2); %Sort relative to second column (Y column); 1 = X, 3 = Z
minY = min(xyzStats(:,2));
maxY = max(xyzStats(:,2));
ConStats = [];
for idx = minY:2:maxY
x = find(xyzStats(:,2)==idx); %Go in increments of 2, since most images are warped to this dimension; however, change if resolution is different
ConStats = [ConStats; mean(xyzStats(min(x):max(x),4))];
end
if maskIdx == 1
Condition1 = [ConStats Condition1];
elseif maskIdx == 2
Condition2 = [ConStats Condition2];
end
end
end
Conditions.Contrasts{1} = Condition1;
Conditions.Contrasts{2} = Condition2;
This script assumes that there are only two conditions; more can be added, but care should be taken to reflect this, especially with the if/else statement near the end of the script. I could refine it to work with any amount of conditions, but that would require effort and talent.
Once these contrasts are loaded into your structure, you can then put them in an Excel spreadsheet or any other program that will allow you to format and save the contrasts in a tab-delimited text format. The goal is to prepare them for analysis in R, where you can test for main effects and interactions across the ROI for your contrasts. In Excel, I like to format it in the following four-column format:
Subject Condition Position Contrast
202 Stroop 0 -0.791985669
202 Stroop 2 -0.558366941
202 Stroop 4 -0.338829942
202 Pain 0 0.17158524
202 Pain 2 0.267789503
202 Pain 4 0.192473782
203 Stroop 0 0.596162455
203 Stroop 2 0.44917655
203 Stroop 4 0.410870348
203 Pain 0 0.722974284
203 Pain 2 0.871030304
203 Pain 4 1.045700207
And so on, depending on how many subjects, conditions, and slices you have. (Note here that I have position in millimeters from the origin in the y-direction; this will depend on your standardized space resolution, which in this case is 2mm per slice.)
Once you export that to a tab-delimited text file, you can then read it into R and analyze it with code like the following:
setwd("~/Desktop")
x = read.table("SliceAnalysis.txt", header=TRUE)
x$Subject <- as.factor="" font="" ubject="" x="">->
aov.x = aov(Contrast~(Condition*Position)+Error(Subject/(Condition*Position)),x)
summary(aov.x)
interaction.plot(x$Position, x$Condition, x$Contrast)
This will output statistics for main effects and interactions, as well as plotting the contrasts against each other as a function of position.
That's it! Enjoy your slices, crack open some jars of sugary products, and have some wild times!
Labels:
fMRI,
Matlab,
neuroimaging,
slice analysis,
SPM
Wednesday, August 6, 2014
DTI Analysis: Soup to Nuts Playlist
Instead of going through each DTI analysis step individually, I've collated everything into a Youtube playlist down below. Just remember that we are using data from the FSL practical course here, and also remember that suing somebody for giving out bad advice, although it is admittedly an easy way to become fantastically wealthy, won't necessarily make you happier.
In any case, just to briefly go over the rest of the steps: After correcting for magnetic field distortions and eddy currents, tensors are fitted using the dtifit command (or simply going through the FDT menu in the FSL interface). Once this has been done for each subject, a series of TBSS tools are used, each one prefixed by "tbss"; for example, tbss_1_preproc, tbss_2_reg, and so on. (You can find all of these in the $FSLDIR/bin directory, and if you have a good handle on Unix programming, you can inspect the code yourself.) After you have run all of those for your dataset, you set up the appropriate experimental design and contrasts, and use the randomise tool to perform statistics in your tractography mask.
Keep in mind that this is just beginner's material; and that if you were to compare your DTI competence to dating, if would be like you were still in that awkward teenager phase, unable to talk to anybody or make eye contact.
However, much of this material has already been covered in other blogs and online resources, provided by several other highly talented scientists and researchers, and - as much as I constantly fantasize about establishing a monopoly over neuroimaging information - there is no practical way to destroy them all.
Therefore, instead of posting redundant information, I highly recommend checking out an ongoing step-by-step series on TORTOISE by Peter Molfese, which you can compare to your results with FSL, and another blog dedicated to diffusion imaging, diffusion-imaging.com. The latter site covers virtually every piece of diffusion imaging software and pipeline out there, and is a good place to start.
Wednesday, May 1, 2013
What Good is Neuroimaging?
If there is one absolute in this universe, it is that people want more stuff. Given the choice between stuff and nothing, people will choose stuff, nine times out of ten. Therefore, as science is a business as well as an intellectual pursuit, any scientist would be well-advised to take a step back once in a while and consider whether his work makes the public feel as though that they are getting more stuff. This gets back to the divide between basic research and translational research: basic research being done more for its own sake, and to just figure stuff out; and translational research, which attempts to bridge basic scientific findings and transform them into improved technologies or therapies.
A recent article in the Journal of Cognitive Neuroscience (Moran & Zaki, 2013) addresses these very issues, stating that neuroimaging has reached a critical mass of exploratory findings through brain mapping, but in order to advance will have to take a more theoretically rigorous approach. In the good old days, it was interesting to do basic exploratory analyses to examine the functional role of large chunks of cortical real estate, such as the visual cortex, auditory cortex, and some subcortical structures. However, the authors maintain that most new exploratory brain analyses - i.e., those that simply want to find out what brain region is responsive to a certain task or a certain stimulus - are rapidly entering the far end of diminishing returns. What is needed, rather, is experiments that can adjudicate between competing theories of brain function, using forward inference to distinguish between alternative hypotheses, instead of reverse inference, which reasons that because a particular region shows more activity than normal, then a particular process must be involved (cf. Poldrack, 2006).
However, even with reverse inference, some assumptions can be made about a cognitive state. For example, with large-scale databases such as Neurosynth, one can quickly see how many studies claim that a given region is involved in a particular cognitive process. This lends more credibility to reverse inference claims that dovetail with evidence from the majority of studies, as opposed to selecting a single study that claimed to have found evidence of a cognitive process associated with a certain area, as this may be more susceptible to a false positive.
For practical uses, however, neuroimaging - and FMRI in particular - has been able to make predictions about behavior based on brain activity. For example, in a growing body of decision-making research, increased activity in the anterior insula predicted better choices in a risky decision-making task (Krawitz et al, 2010), and within a group of smokers shown anti-tobacco ads, dorso-medial prefrontal cortex activity predicted levels of a nicotine metabolite at a later follow-up (Wang et al, 2013). This seems to be a profitable avenue of neuroimaging research, as neural activity can provide more information about effective treatment programs, from drug PSAs to psychological therapies, above and beyond behavioral measures.
In light of all this, the evidence suggests that, although brain mapping for its own sake will continue to be popular, the higher-impact work appears to be shifting more emphatically in the direction of translational research. The human desire for stuff will always trump the human desire of curiosity, and the researcher would be wise to pay heed to this, lest he be swallowed up in darkness.
A recent article in the Journal of Cognitive Neuroscience (Moran & Zaki, 2013) addresses these very issues, stating that neuroimaging has reached a critical mass of exploratory findings through brain mapping, but in order to advance will have to take a more theoretically rigorous approach. In the good old days, it was interesting to do basic exploratory analyses to examine the functional role of large chunks of cortical real estate, such as the visual cortex, auditory cortex, and some subcortical structures. However, the authors maintain that most new exploratory brain analyses - i.e., those that simply want to find out what brain region is responsive to a certain task or a certain stimulus - are rapidly entering the far end of diminishing returns. What is needed, rather, is experiments that can adjudicate between competing theories of brain function, using forward inference to distinguish between alternative hypotheses, instead of reverse inference, which reasons that because a particular region shows more activity than normal, then a particular process must be involved (cf. Poldrack, 2006).
However, even with reverse inference, some assumptions can be made about a cognitive state. For example, with large-scale databases such as Neurosynth, one can quickly see how many studies claim that a given region is involved in a particular cognitive process. This lends more credibility to reverse inference claims that dovetail with evidence from the majority of studies, as opposed to selecting a single study that claimed to have found evidence of a cognitive process associated with a certain area, as this may be more susceptible to a false positive.
For practical uses, however, neuroimaging - and FMRI in particular - has been able to make predictions about behavior based on brain activity. For example, in a growing body of decision-making research, increased activity in the anterior insula predicted better choices in a risky decision-making task (Krawitz et al, 2010), and within a group of smokers shown anti-tobacco ads, dorso-medial prefrontal cortex activity predicted levels of a nicotine metabolite at a later follow-up (Wang et al, 2013). This seems to be a profitable avenue of neuroimaging research, as neural activity can provide more information about effective treatment programs, from drug PSAs to psychological therapies, above and beyond behavioral measures.
In light of all this, the evidence suggests that, although brain mapping for its own sake will continue to be popular, the higher-impact work appears to be shifting more emphatically in the direction of translational research. The human desire for stuff will always trump the human desire of curiosity, and the researcher would be wise to pay heed to this, lest he be swallowed up in darkness.
Labels:
curiosity,
neuroimaging,
so what,
stuff,
what good is it
Thursday, April 18, 2013
CNS 2013 Review
Last weekend marked my second attendance of the Cognitive Neuroscience Society conference, and I had a terrific time, each night full of drinking, wenching, gaming, brawling, dancing, freethinking, casuistry, and innumerable other vices. I dined on the best seafood that San Francisco had to offer, devouring breadbowls of clam chowder and pots of carmelized catfish and platters of sushi. I witnessed fights between sea lions, observed the Golden Gate bridge expand and contract in proportion to its temperature, and toured the Ghiradelli chocolate factory complex. Having access to a television for the first time in months, I watched the last half of S.W.A.T. and the first half of Face/Off, which, taken together, made for a satisfying, full-length action movie.
However, I also managed to find the time to go to some talks and posters detailing the latest findings in my field. A few trends I noticed:
1. Development and aging are hot right now, particularly since a large segment of the population is approaching old age and beginning to experience the effects of dementia, senescence, and increased irritability at perceived injustices, such as when your children fail to call you when they say that they will. I saw several posters looking at cognitive control effects over time, and how different interventions affected measures of executive function; and since the baby boomers are funding a large part of this research, so the importance of this field will continue to grow in proportion to their collective terror in the face of aging and its associated infirmities, creeping maladies seen from a distance yet unstoppable, as a man bound to a stake in the middle of a desert might feel as he is approached by irate wildlife.
2. Cognitive strategies such as mindfulness meditation and reappraisal are also hot right now; and although they might seem a bit faddish, the evidence of their efficacy is compelling. Expect to see more of these and their ilk increasingly applied across a wider variety of pathologies, such as depression, chronic pain, tinnitus, and addiction.
Lastly, while supping at the Ghiradelli chocolate factory with a postdoc, he mentioned that he was miffed by the lack of theory-driven experiments in several of the posters he saw. That is to say, several posters would lead in with a statement such as "Much research has been done on topic X. However, relatively little is known about Y...", with an experiment devoted to the effects of Y. In my colleague's opinion, this leads to a broadening of the field without refining or testing any of the existing theories. Indeed, if any think his fears to be unfounded, here I reprint an abstract seen at the conference which would appear to support his apprehensions about unfocused research endeavors:
Clearly, some restraint is necessary when deciding what experiments to carry out, as there are an infinite number of questions to study, but which must, from time to time, be bound together under cohesive theories.
Overall, I had a great time, and am looking forward to CNS 2014!
However, I also managed to find the time to go to some talks and posters detailing the latest findings in my field. A few trends I noticed:
1. Development and aging are hot right now, particularly since a large segment of the population is approaching old age and beginning to experience the effects of dementia, senescence, and increased irritability at perceived injustices, such as when your children fail to call you when they say that they will. I saw several posters looking at cognitive control effects over time, and how different interventions affected measures of executive function; and since the baby boomers are funding a large part of this research, so the importance of this field will continue to grow in proportion to their collective terror in the face of aging and its associated infirmities, creeping maladies seen from a distance yet unstoppable, as a man bound to a stake in the middle of a desert might feel as he is approached by irate wildlife.
2. Cognitive strategies such as mindfulness meditation and reappraisal are also hot right now; and although they might seem a bit faddish, the evidence of their efficacy is compelling. Expect to see more of these and their ilk increasingly applied across a wider variety of pathologies, such as depression, chronic pain, tinnitus, and addiction.
Lastly, while supping at the Ghiradelli chocolate factory with a postdoc, he mentioned that he was miffed by the lack of theory-driven experiments in several of the posters he saw. That is to say, several posters would lead in with a statement such as "Much research has been done on topic X. However, relatively little is known about Y...", with an experiment devoted to the effects of Y. In my colleague's opinion, this leads to a broadening of the field without refining or testing any of the existing theories. Indeed, if any think his fears to be unfounded, here I reprint an abstract seen at the conference which would appear to support his apprehensions about unfocused research endeavors:
Title: The neural correlates of pooping
Author: Will Brown, M.D., Ph.D.
Abstract: Pooping is an adaptive evolutionary behavior observed to occur across a wide range of species, including dogs, birds, armadillos, and humans, with evolutionary psychologists believing it to serve as a biomarker for fitness and reproductive success. Much research has been done on pooping, but to our knowledge this has not yet been systematically examined using FMRI. In our first study we scanned 28 participants while pooping. Robust activation was observed in bilateral pre-SMA, dorsal ACC, and bilateral insula, which we have dubbed the "pooping network". The second study scanned the same participants while they watched videos of other humans or robots either reading or pooping, creating a 2x2 factorial design. All poops were controlled for size, pungency, luminance, texture, and nuttiness, using the Jeff Goldblum Excrement Control Scale. The contrast of HumanPoops - RobotPoops was associated with activity in the superior temporal sulcus, consistent with this region's role in processing socially relevant actions. By contrast, a main effect of observing poops collapsed across humans and robots led to increased activation in the inferior frontal gyrus, premotor cortex, and parietal cortex, a finding similar to other studies investigating mirror neurons, suggesting that mirror neurons may be essential for helping organisms learn how to poop. These results better inform our understanding of pooping, and may lead to mindfulness meditation and cognitive reappraisal treatments for pooping-related disorders, such as constipation, irritable bowel syndrome, and explosive diarrhea.
Clearly, some restraint is necessary when deciding what experiments to carry out, as there are an infinite number of questions to study, but which must, from time to time, be bound together under cohesive theories.
Overall, I had a great time, and am looking forward to CNS 2014!
Labels:
cognitive neuroscience society,
faceoff,
fMRI,
neuroimaging,
swat,
theory
Wednesday, February 20, 2013
Model-Based FMRI Analysis: Thoughts
Model-based FMRI analysis is so hot right now. It's so hot, it could take a crap, wrap it in tin foil, put hooks on it, and sell it as earrings to the Queen of England.* It seems as though every week, I see another model-based study appear in Journal of Neuroscience, Nature Neuroscience, and Humungo Garbanzo BOLD Responses. Obviously, in order to effect our entry into such an elite club, we should understand some of the basics of what it's all about.
When people ask me what I do, I usually reply "Oh, this and that." When pressed for details, I panic and tell them that I do model-based FMRI analysis. In truth, I sit in a room across from the guy who actually does the modeling work, and then simply apply it to my data; very little of what I do requires more than the mental acumen needed to operate a stapler. However, I do have some foggy notions about how it works, so pay heed, lest you stumble and fall when pressed for details about why you do what you do, and are thereupon laughed at for a fool.
Using a model-based analysis is conceptually very similar to what we do with a basic univariate analysis with the canonical Blood Oxygenation Level Dependent (BOLD) response; with the canonical BOLD response, we have a model for what we think the signal should look like in response to an event, either instantaneous or over a longer period of time, often by convolving each event with a mathematically constructed gamma function called the hemodynamic response function (HRF). We then use this to construct an ideal model of what we think the signal at each voxel should look like, and then increase or decrease the height of each HRF in order to optimize the fit of our ideal model to the actual signal observed in each voxel.
Model-based analyses add another layer to this by providing an estimate of how much the height of this HRF can fluctuate (or "modulate") in response to additional continuous (or "parametric") data for each trial, such as reaction time. The model can provide estimates for how much the BOLD signal should vary on a trial-by-trial basis, which are then inserted into the general linear model (GLM) as parametric modulators; the BOLD response can then correlate either positively or negatively with the parametric modulator, signaling whether more or less of that modulator leads to increased or decreased height in the BOLD response.
To illustrate this, a recent paper by Ide et al (2013) applied a Bayesian model to a simple stop-go task, in which participants either had Go trials in which participants made a response, or Stop trials in which participants had to inhibit their response.The stop signal appeared only on a fraction of the trials, but after a variable delay, which made it difficult to predict when the stop signal would occur. The researchers used a Bayesian model in order to update the estimated prior about the occurrence of the stop signal, as well as the probability of committing an error. Think of the model as representing what an ideal subject would do, and try to place yourself in his shoes; after a long string of Go trials, you begin to suspect more and more that the next trial will have a Stop signal. When you are highly certain that a Stop signal will occur, but it doesn't, according to the model that should lead to greater activity, as captured by the parametric modulator generated by the model on that trial. This is applied to each subject and then observed where it is a good fit relative to the observed timecourse at each voxel.
In addition to neuroimaging data, it is also useful to compare model predictions to behavioral data. For reaction time, to use one example, RT should go up as the expectancy for a stop signal also increases, as a subject with a higher subjective probability for a stop signal will take more time in order to avoid committing an error. The overlay of model predictions and behavioral data collected from subjects provides a useful validation check of the model predictions:
Note, however, that this is a Bayesian model as applied to the mind; it's an estimation of what the experimenters think the subject is thinking during the task, given the trial history and what happens on the current trial. In this study, the methods for testing the significance and size of the parameter estimates are still done using null hypothesis significance testing methods.
*cf. Zoolander, 2001
When people ask me what I do, I usually reply "Oh, this and that." When pressed for details, I panic and tell them that I do model-based FMRI analysis. In truth, I sit in a room across from the guy who actually does the modeling work, and then simply apply it to my data; very little of what I do requires more than the mental acumen needed to operate a stapler. However, I do have some foggy notions about how it works, so pay heed, lest you stumble and fall when pressed for details about why you do what you do, and are thereupon laughed at for a fool.
Using a model-based analysis is conceptually very similar to what we do with a basic univariate analysis with the canonical Blood Oxygenation Level Dependent (BOLD) response; with the canonical BOLD response, we have a model for what we think the signal should look like in response to an event, either instantaneous or over a longer period of time, often by convolving each event with a mathematically constructed gamma function called the hemodynamic response function (HRF). We then use this to construct an ideal model of what we think the signal at each voxel should look like, and then increase or decrease the height of each HRF in order to optimize the fit of our ideal model to the actual signal observed in each voxel.
Model-based analyses add another layer to this by providing an estimate of how much the height of this HRF can fluctuate (or "modulate") in response to additional continuous (or "parametric") data for each trial, such as reaction time. The model can provide estimates for how much the BOLD signal should vary on a trial-by-trial basis, which are then inserted into the general linear model (GLM) as parametric modulators; the BOLD response can then correlate either positively or negatively with the parametric modulator, signaling whether more or less of that modulator leads to increased or decreased height in the BOLD response.
To illustrate this, a recent paper by Ide et al (2013) applied a Bayesian model to a simple stop-go task, in which participants either had Go trials in which participants made a response, or Stop trials in which participants had to inhibit their response.The stop signal appeared only on a fraction of the trials, but after a variable delay, which made it difficult to predict when the stop signal would occur. The researchers used a Bayesian model in order to update the estimated prior about the occurrence of the stop signal, as well as the probability of committing an error. Think of the model as representing what an ideal subject would do, and try to place yourself in his shoes; after a long string of Go trials, you begin to suspect more and more that the next trial will have a Stop signal. When you are highly certain that a Stop signal will occur, but it doesn't, according to the model that should lead to greater activity, as captured by the parametric modulator generated by the model on that trial. This is applied to each subject and then observed where it is a good fit relative to the observed timecourse at each voxel.
In addition to neuroimaging data, it is also useful to compare model predictions to behavioral data. For reaction time, to use one example, RT should go up as the expectancy for a stop signal also increases, as a subject with a higher subjective probability for a stop signal will take more time in order to avoid committing an error. The overlay of model predictions and behavioral data collected from subjects provides a useful validation check of the model predictions:
Note, however, that this is a Bayesian model as applied to the mind; it's an estimation of what the experimenters think the subject is thinking during the task, given the trial history and what happens on the current trial. In this study, the methods for testing the significance and size of the parameter estimates are still done using null hypothesis significance testing methods.
*cf. Zoolander, 2001
Wednesday, February 13, 2013
Finding the Right Subjects for Your FMRI Study
When asked, What is the most important part of an experiment?, some will tell you that it lies in careful, considered deliberation about the design of the study, and being able to accurately tease apart alternative explanations of the results; others will say that emphasis should be placed on technical finesse, statistical competence, and strictly adhering to the rules governing good experimental behavior, including correcting for your critical p-value every time you peek at the data - each viewing like another lashing from the scourge of science.
However, what these people fail to mention is the selection of subjects, which, if overlooked or neglected, will render all of the other facets of your experiment moot. Good subjects provide good data; or, at the very least, reliable data, as you will be certain that they performed the task as instructed; that they were alert, awake, and engaged, and that therefore any issues with your results must be attributed to your design, your construct, or technical problems, but that any problems due to the individuals in your experiment must be ruled out.
To honor this observation, I am constantly on the lookout for fresh cerebrums to wheedle and coax to participate in my studies; during my walk to work I observe in a nearby pedestrian a particularly promising yet subtle eminence on the frontal bone, and silently estimate the amount of cubic centimeters that must therefore be located within Brodmann's Area Number Ten; I sidle up to a young girl at the bar, and after a few minutes of small talk and light banter, playfully brush aside a few unruly strands of her hair and place it behind her ear, taking the opportunity to lightly trace the arc of her squamous suture with my finger, feel the faint pulse of her temporal artery, and fantasize about the blood flowing to the auditory association cortex in response to strings of nonsense vowels. "Do you like playing with my hair?" she asks coyly. "Yes," I manage to stammer, roused from my reverie; "It is beautiful - Beautiful!"
There is one qualm I have with selecting good subjects, however. Often they are people I know, or they are referred by reliable friends, so that I have little doubt that they will be able to successfully carry out their charge. Often they are young, college-aged, healthy, right-handed, intelligent, motivated, and desperate for cash; and as I think about the generalizability of my results, I cannot help but conclude that my results are only generalizable to people like this. A great number of people, either not having enough regard to follow the instructions, or not neurotic enough to care about how they do on the task as they would on a test, perform at a suboptimal level and are thereby excluded; else, they are not even recruited in the first place. This becomes more of a concern when moving beyond simple responses to visual and auditory stimuli, and into higher-level tasks such as decision-making, and I begin to question what meaning my results have for the great mass of humanity; but then I simply stir in more laudanum into my coffee, drink deep from the dregs of Lethe, and sink into carefree oblivion.
In any case, once you have found a good subject, odds are that they also know good subjects; and it is prudent to have them contact their friends and acquaintances, in order to rapidly fill up your subject quota. However, when this approach fails me, and I am strapped for participants, I try a viral marketing approach: As each subject is paid about fifty dollars for two hours of scanning time, upon completion of the study and payment of the subject, I request that they convert their money into fifty one-dollar bills, go to some swank location - such as a hockey game, gentleman's club, or monster truck rally - and take a picture of themselves holding the bills spread out like a fan in one hand and a thumbs-up in the other, while underneath the picture in impact font are the words ANDY HOOKED ME UP. This leads to a noticeable spike in requests for participating in my study, although not always from the clientele that I would like.
However, what these people fail to mention is the selection of subjects, which, if overlooked or neglected, will render all of the other facets of your experiment moot. Good subjects provide good data; or, at the very least, reliable data, as you will be certain that they performed the task as instructed; that they were alert, awake, and engaged, and that therefore any issues with your results must be attributed to your design, your construct, or technical problems, but that any problems due to the individuals in your experiment must be ruled out.
To honor this observation, I am constantly on the lookout for fresh cerebrums to wheedle and coax to participate in my studies; during my walk to work I observe in a nearby pedestrian a particularly promising yet subtle eminence on the frontal bone, and silently estimate the amount of cubic centimeters that must therefore be located within Brodmann's Area Number Ten; I sidle up to a young girl at the bar, and after a few minutes of small talk and light banter, playfully brush aside a few unruly strands of her hair and place it behind her ear, taking the opportunity to lightly trace the arc of her squamous suture with my finger, feel the faint pulse of her temporal artery, and fantasize about the blood flowing to the auditory association cortex in response to strings of nonsense vowels. "Do you like playing with my hair?" she asks coyly. "Yes," I manage to stammer, roused from my reverie; "It is beautiful - Beautiful!"
There is one qualm I have with selecting good subjects, however. Often they are people I know, or they are referred by reliable friends, so that I have little doubt that they will be able to successfully carry out their charge. Often they are young, college-aged, healthy, right-handed, intelligent, motivated, and desperate for cash; and as I think about the generalizability of my results, I cannot help but conclude that my results are only generalizable to people like this. A great number of people, either not having enough regard to follow the instructions, or not neurotic enough to care about how they do on the task as they would on a test, perform at a suboptimal level and are thereby excluded; else, they are not even recruited in the first place. This becomes more of a concern when moving beyond simple responses to visual and auditory stimuli, and into higher-level tasks such as decision-making, and I begin to question what meaning my results have for the great mass of humanity; but then I simply stir in more laudanum into my coffee, drink deep from the dregs of Lethe, and sink into carefree oblivion.
In any case, once you have found a good subject, odds are that they also know good subjects; and it is prudent to have them contact their friends and acquaintances, in order to rapidly fill up your subject quota. However, when this approach fails me, and I am strapped for participants, I try a viral marketing approach: As each subject is paid about fifty dollars for two hours of scanning time, upon completion of the study and payment of the subject, I request that they convert their money into fifty one-dollar bills, go to some swank location - such as a hockey game, gentleman's club, or monster truck rally - and take a picture of themselves holding the bills spread out like a fan in one hand and a thumbs-up in the other, while underneath the picture in impact font are the words ANDY HOOKED ME UP. This leads to a noticeable spike in requests for participating in my study, although not always from the clientele that I would like.
Monday, February 11, 2013
Using SPM.mat to Stay on Track
Life, I have observed, is a constant struggle between our civilized taste for the clean, the neat, and the orderly, on the one hand, and the untrammeled powers of disorganization, disorder, and chaos, on the other. We feel compelled to organize our household and our domestic sphere, including the arrangement of books and DVDs in alphabetical order, placing large items such as vacuum cleaners and plungers in sensible locations when we are done with them, and cleaning and putting away the dishes at least once a week. However, this all takes time and effort, which is anathema to our modern tendency to demand everything immediately.
The same is true - especially, painfully true - in analyzing neuroimaging data. Due to the sheer bulk of data collected during the course of a typical study, and the continual and irresponsible reproduction and multiplication of files, numbers, and images for each analysis, dealing with such a formidable and ever-increasing mountain of information can be paralyzing. The other day, for example, I was requested to run an analysis similar to another analysis I had done many months before; but with little idea of how I had done the first analysis in the first place, I was at a complete loss as to where to start. Foreseeing scenarios such as this, I had taken the precaution to place a trail of text files in each directory where I had performed a step or changed a file, in the hopes that it would enslicken my brain and guide me back into the mental grooves of where I had been previously. However, a quick scan of the document made my heart sink like an overkneaded loaf of whole wheat bread, as I realized deciphering my original intentions would baffle the most intrepid cryptologist. Take, for example, the following:
README.txt
---------------
20 July 2011
Input data into cell matrix of dimensions 30x142x73; covariates entered every other row, in order to account for working memory span, self-report measure of average anxiety levels after 7pm, and onset of latest menstrual cycle. Transposed matrix to factor out singular eigenvariates and determinants, then convolved with triple-gamma hemodynamic response function to filter out Nyquist frequency, followed by reverse deconvolution and arrangement of contrast images into pseudo-Pascal's Triangle. I need scissors! 61!
Deepening my confusion was a list of cross-references to handwritten notes I had scribbled and scrawled in the margins of notebooks and journals over the course of months and years, quite valuable back then, quite forgotten now, as leafing through the pages yielded no clue about when it was written (I am terrible at remembering to mark down dates), or what experiment the notes were about. But just as the flame of hope is about to be snuffed out forever, I usually espy a reference to a document located once again on my computer in a Dropbox folder, and I am filled with not so much pride or hope, as gladness at some end descried; which invariably sets me again on a wild goose chase through the Byzantine bowels of our server, which, if not precisely yielding any concrete result, at least makes me feel stressed and harried, and therefore productive.
Imagine my consternation then, during the latest round of reference-chasing, when I came to the point where I could go no further; where there was not even a chemical trace of where to go next, or what, exactly, I was looking for in the first place. My mind reeled; my spine turned to wax; my soul sank faster than the discharge of a fiberless diet. At wit's end, I cast about for a solution to my predicament, as I mentally listed my options. Ask for help? Out of the question; as an eminently and internationally respected neuroscience blogger, to admit ignorance or incompetence in anything would be a public relations disaster. Give up? As fond a subscriber as I am to the notion that discretion is the better part of valor, and as true a believer as any that there is nothing shameful, base, or humiliating about retreating, surrendering, or rearguard actions, this situation hardly seemed to merit my abject capitulation; and deep down I knew that overcoming this obstacle and chronicling my struggle would inspire my children and grandchildren to similar feats of bravery.
And so it was precisely at this moment, at the nadir of my existence, in the slough of despond, that, through either the random firing of two truculent interneurons in my hippocampus or through intervention by the divine hand of Providence, I had a sudden epiphany. The circumstances of my present situation echoed parallels to the gruesome detective stories I used to read as a child straight before bedtime, and I imagined myself standing in the shoes of a fleabitten detective attempting to piece together the origin and denouement of a puzzling murder, as in Gore by the Gallon or Severed Throats; and I therefore reasoned that, as every strangulation, bludgeoning, shooting, stabbing, poisoning, drowning, and asphyxiation leave traces of their author, so too must each analysis bear the fingerprint of its researcher. Straightaway I navigated to the directory of the analysis I was attempting to replicate, loaded the SPM.mat file into memory, displayed its contents, and quickly realized that I had no idea what any of it meant.
Thus, although the output of the SPM.mat file appears to me as hieroglyphs, I have faith that a more experienced user will know what they mean; and it still stands to reason that these files do contain everything that was done to create them, much as the strands of genetic information coursing through our bodies are virtual volumes of the history of the gonads and gametes from whence they came. I encourage the beginning neuroimager to be aware of this, as the designers of these software packages have proved far more prescient than we, and have installed safeguards to prevent us from the ill effects of our own miserable disorganization.
The same is true - especially, painfully true - in analyzing neuroimaging data. Due to the sheer bulk of data collected during the course of a typical study, and the continual and irresponsible reproduction and multiplication of files, numbers, and images for each analysis, dealing with such a formidable and ever-increasing mountain of information can be paralyzing. The other day, for example, I was requested to run an analysis similar to another analysis I had done many months before; but with little idea of how I had done the first analysis in the first place, I was at a complete loss as to where to start. Foreseeing scenarios such as this, I had taken the precaution to place a trail of text files in each directory where I had performed a step or changed a file, in the hopes that it would enslicken my brain and guide me back into the mental grooves of where I had been previously. However, a quick scan of the document made my heart sink like an overkneaded loaf of whole wheat bread, as I realized deciphering my original intentions would baffle the most intrepid cryptologist. Take, for example, the following:
README.txt
---------------
20 July 2011
Input data into cell matrix of dimensions 30x142x73; covariates entered every other row, in order to account for working memory span, self-report measure of average anxiety levels after 7pm, and onset of latest menstrual cycle. Transposed matrix to factor out singular eigenvariates and determinants, then convolved with triple-gamma hemodynamic response function to filter out Nyquist frequency, followed by reverse deconvolution and arrangement of contrast images into pseudo-Pascal's Triangle. I need scissors! 61!
Deepening my confusion was a list of cross-references to handwritten notes I had scribbled and scrawled in the margins of notebooks and journals over the course of months and years, quite valuable back then, quite forgotten now, as leafing through the pages yielded no clue about when it was written (I am terrible at remembering to mark down dates), or what experiment the notes were about. But just as the flame of hope is about to be snuffed out forever, I usually espy a reference to a document located once again on my computer in a Dropbox folder, and I am filled with not so much pride or hope, as gladness at some end descried; which invariably sets me again on a wild goose chase through the Byzantine bowels of our server, which, if not precisely yielding any concrete result, at least makes me feel stressed and harried, and therefore productive.
Imagine my consternation then, during the latest round of reference-chasing, when I came to the point where I could go no further; where there was not even a chemical trace of where to go next, or what, exactly, I was looking for in the first place. My mind reeled; my spine turned to wax; my soul sank faster than the discharge of a fiberless diet. At wit's end, I cast about for a solution to my predicament, as I mentally listed my options. Ask for help? Out of the question; as an eminently and internationally respected neuroscience blogger, to admit ignorance or incompetence in anything would be a public relations disaster. Give up? As fond a subscriber as I am to the notion that discretion is the better part of valor, and as true a believer as any that there is nothing shameful, base, or humiliating about retreating, surrendering, or rearguard actions, this situation hardly seemed to merit my abject capitulation; and deep down I knew that overcoming this obstacle and chronicling my struggle would inspire my children and grandchildren to similar feats of bravery.
And so it was precisely at this moment, at the nadir of my existence, in the slough of despond, that, through either the random firing of two truculent interneurons in my hippocampus or through intervention by the divine hand of Providence, I had a sudden epiphany. The circumstances of my present situation echoed parallels to the gruesome detective stories I used to read as a child straight before bedtime, and I imagined myself standing in the shoes of a fleabitten detective attempting to piece together the origin and denouement of a puzzling murder, as in Gore by the Gallon or Severed Throats; and I therefore reasoned that, as every strangulation, bludgeoning, shooting, stabbing, poisoning, drowning, and asphyxiation leave traces of their author, so too must each analysis bear the fingerprint of its researcher. Straightaway I navigated to the directory of the analysis I was attempting to replicate, loaded the SPM.mat file into memory, displayed its contents, and quickly realized that I had no idea what any of it meant.
Thus, although the output of the SPM.mat file appears to me as hieroglyphs, I have faith that a more experienced user will know what they mean; and it still stands to reason that these files do contain everything that was done to create them, much as the strands of genetic information coursing through our bodies are virtual volumes of the history of the gonads and gametes from whence they came. I encourage the beginning neuroimager to be aware of this, as the designers of these software packages have proved far more prescient than we, and have installed safeguards to prevent us from the ill effects of our own miserable disorganization.
Saturday, December 8, 2012
Insights into the Vegetative State Using Humor
A few days ago I stumbled upon an article talking about Adrian Owen's work with vegetative state patients, and in an instant I was mentally transported to my sophomore year of college, when I first read one of his papers. I remember it like it was just yesterday; an unseasonably warm and humid May afternoon in my cognitive psychology class; just outside the window, you could hear the whine of the midges intermingling with the screams of children, and everywhere the Minnesota foliage was pullulating into life, those emerald prairies and celadon canopies of the Arboretum soaking up as much water and air and oxygen as they required. And in front of us at the head of the classroom stood imperious Professor Brockton, his left hand bepurpled with a chemical burn from an unknown wetlab incident, that crazed stain traveling up his palm and disappearing within the cuff of his neatly pressed Stafford shirt, leaving us to wonder exactly how far it went before terminating.
But above all, I remember discussing in class that day how neuroimaging had provided some evidence that patients supposedly in comas and vegetative states could still process information from the outside world, such as being asked to imagine playing tennis, which, to me, was astonishing. It was at that moment I had an epiphany and realized what I wanted to do with my life; I wanted to be - a professional tennis player.
No, wait! I meant, a cognitive neuroscientist. Kind of like a regular neuroscientist, except with an additional term to set us apart and let everyone know how special we are.
In any case, Owen has gotten a lot of press in the past few years conducting these types of experiments on people in vegetative states. Specifically, he uses paradigms where he scans individuals while asking them to imagine doing different tasks, such as playing tennis, going around different rooms of their house, and neuroscience blogging. The results were striking: subjects in a vegetative state, who otherwise have no way of communicating with anyone else, showed similar patterns of brain activity to healthy controls who imagined the same scenarios, suggesting that they actually could understand what was going on around them, even though they couldn't talk or move their limbs. A similar procedure was then used to ask yes/no questions to the patients, and see whether they could respond by selectively increasing blood flow to certain regions of the brain through thinking about specific things; and now, the next obvious step - at least in my mind - is to use this to figure out which part of the patient's body is itchy. (Seriously, think about it; you talk about helping people, this is where you start.)
More recently, Owen has investigated whether these same subjects are able to understand and appreciate humor. For example, he scanned the subjects while presenting them with humor - puns, wordplay, reading Andy's Brain Blog - and observed whether the patients responded similarly to how normally functioning individuals process humor. Elevated levels of activity were found in the frontal lobes and limbic system the funnier the joke was; and once you start throwing around terms like "limbic system", you know it's gotta be true.
Labels:
adrian owen,
fMRI,
humor,
imagery,
kinderszenen,
memories,
neuroimaging,
spatial navigation,
tennis,
vegetative state
Thursday, September 13, 2012
Erotic Neuroimaging Journal Titles
| Yes...YES |
With all this talk about sexy results these days, I think that there should be a special line of erotic neuroimaging journals dedicated to publishing only the sexiest, sultriest results. Neuroscientist pornography, if you will.
Some ideas for titles:
-Huge OFC Activations
-Blobs on Brains
-Exploring Extremely Active Regions of Interest
-Humungo Garbanzo BOLD Responses
-Deep Brain Stimulations (subtitle: Only the Hottest, Deepest Stimulations)
-Journal of where they show you those IAPS snaps, and the first one is like a picture of a couple snuggling, and you're like, oh hells yeah, here we go; and then they show you some messed-up photo of a charred corpse or a severed hand or something. The hell is wrong with these people? That stuff is gross; it's GROSS.
Think of the market for this; think of how much wider an audience we could attract if we played up the sexy side of science more. Imagine the thrill, for example, of walking into your advisor's office as he hastily tries to hide a copy of Humungo Garbanzo inside his desk drawer. Life would be fuller and more interesting; the lab atmosphere would be suffused with sexiness and tinged with erotic anticipation; the research process would be transformed into a non-stop bacchanalia. Someone needs to step up and make this happen.
Sunday, August 26, 2012
A Survey of Methods Reporting
| Figure 1: Why you are (probably) a slacker Taken from Carp, 2012 |
A recent article in NeuroImage suggests that we cognitive neuroscientists aren't providing our methods in adequate detail when we submit articles for publication. Is it because we're all lazy, shiftless academic scum? Absolutely.
However, that is only part of the problem, according to the publication author, Joshua Carp. Because neuroimaging processing pipelines are so complex and multifaceted, the number of unique ways to process a given set of data rapidly approaches infinity (or at least several thousand). Of course, there are more reasonable ways to analyze data than others; for example, you probably wouldn't want to smooth your data before doing registration, because that would be straight-up bonkers. However, it can be done, and, based on the article, a substantial fraction of studies published from 2007 to 2011 do not provide adequate information for replication, leaving it an open question for whether a failure to replicate a given result represents a failure of the replication study, or whether the initial result was a false positive. Furthermore, this increased flexibility in processing leads to a greater likelihood of producing false positives, and makes it less likely that another lab will be able to reproduce a given experiment (see, for example, Ioannidis's 2005 paper on the subject).
To mitigate this problem, Carp suggests that neuroimagers adhere to the guidelines provided by Russ Poldrack in his 2008 paper, including providing details about number of subjects, number of runs (a surprising amount of studies did not report this, according to Carp), how ROI analyses were performed, how to present results, and so forth. I agree that these are all important things to report, although I also happen to agree with Carp that some of the more technical details, such as signal scaling, are provided as a default in programs such as SPM and often aren't given another thought; whereas something like smoothing, which has a higher likelihood of being changed based on the question being addressed, is more often to be reported. Thus Carp's suggestion that more journals provide a supplementary material section for all of the nitty-gritty details, I believe, is a good one.
In any case, another timely reminder (for me at least) about methods reporting and why it matters.
Labels:
false positives,
guidelines,
Ioannidis,
Joshua Carp,
neuroimaging,
Russ Poldrack,
slackers
Saturday, August 25, 2012
Unix for Neuroimagers: Shells and Variables
First, a few updates:
1) We just finished our first week of the semester here, and although things haven't been too busy, it may be a couple of weeks before I get back on a steady updating schedule. I'll do what I can to keep dropping that fatty knowledge on the regular, and educating your pale, soy-latte-white, Famous Dave's BBQ-stained faces on how to stay trill on that data and stack that cheddah to the ceiling like it's your job. And if you got one of those blogs dedicated to how you and your virgin-ass Rockband-playing frat brothers with names like Brady and Troy and Jason eating those cucumber salad sandwiches or whatever and you drop a link to this site, I'll know it. You show me that love, and I show it right the hell back.
2) While you're here, how about you donate a piece of that stack to the American Cancer Society. I mean, damn; I'm out there seven days a week on those roads, sweating and suffering, but you - you're at work procrastinating again, wringing your snow-bunny white hands over whether you should drop out of graduate school or just toughen it out and graduate in eight years, and while you're at it possibly take a swipe at that new Italian breezey who just entered the neuroscience program. Donate first, worry about those problems later.
3) We got another performance for you all this November, including Schumann's Adagio and Allegro for cello and piano, Resphigi's Adagio con Variazioni, and the Debussy cello sonata. Time and location TBA. Also, more music videos will be uploaded soon, but while you're waiting, you can listen to the latest Mozart Fantasie in D Minor, which has proved one of my most popular videos to date; last I checked, it had 57 views, which I think qualifies for viral status. We goin' worldwide, baby! World-WIDE!!
4) AFNI tutorials are next on the docket, after wrapping up the intro Unix tutorials for neuroimagers, and possibly doing a couple more FSL tutorials on featquery, FSL's ROI analysis tool. Beyond that, there isn't much else I have to say about it; now that you've mastered the basics, you should be able to get the program to jump through whatever hoops you set up for it and to do whatever else you need. There are more complex and sophisticated tools in FSL, to be sure, but that isn't my focus; I will, on the other hand, be going into quite a lot of details with AFNI, including how to run functional connectivity and MVPA analyses. It will take time, but we will get there; as with the FSL tutorials, I'll start from the bottom up.
Anyway, the latest Unix tutorial covers the basics on shells and variables. Shells are just ways of interfacing with the Unix OS; different shells, such as the t-shell (tcsh) and bash shell, do the same thing, but have different syntax and different nomenclature for how they execute commands. So, for example, an if/else statement in the t-shell looks different from a similar statement in the bash shell.
Overall, there's no need to worry too much about which shell you use, although AFNI's default is tcsh, so you may want to get yourself used to that before doing too much with AFNI. I myself use tcsh virtually all of the time, except for a few instances where bash is the only tool that works for the job (running processes on IU's supercomputer, Quarry, comes to mind). There are lots of tcsh haters out there for reasons that are beyond me, but for everything that I do, it works just fine.
As for variables, this is one of the first things you get taught in any intro computer science class, and those of you who have used other software packages, such as R or Matlab, already know what a variable is. In a nutshell, a variable is a thing that has a value. The value can be a string, or a letter, or a number, or pretty much anything. So, for example, when I type in the command
From there, you can build up more complicated scripts and, by having the variable as a placeholder in various locations in your script, only have to change the value assigned to it in order to change the value in each of those locations. It makes your programming more flexible and easier to read and understand, and is critical to know if you wish to make sense of the example scripts generated by AFNI's "uber" scripts.
With all of the tutorials so far, you have essentially all of the fundamentals you need to operate FSL. Really, you only need to understand how to open up a terminal and make sure your path is pointing to the FSL binaries, but after that, all you need to do is understand the interface, and you can get by with pointing and clicking. However, a more sophisticated understanding is needed for AFNI, which will be covered soon. Very soon. Patience, my pretties.
1) We just finished our first week of the semester here, and although things haven't been too busy, it may be a couple of weeks before I get back on a steady updating schedule. I'll do what I can to keep dropping that fatty knowledge on the regular, and educating your pale, soy-latte-white, Famous Dave's BBQ-stained faces on how to stay trill on that data and stack that cheddah to the ceiling like it's your job. And if you got one of those blogs dedicated to how you and your virgin-ass Rockband-playing frat brothers with names like Brady and Troy and Jason eating those cucumber salad sandwiches or whatever and you drop a link to this site, I'll know it. You show me that love, and I show it right the hell back.
2) While you're here, how about you donate a piece of that stack to the American Cancer Society. I mean, damn; I'm out there seven days a week on those roads, sweating and suffering, but you - you're at work procrastinating again, wringing your snow-bunny white hands over whether you should drop out of graduate school or just toughen it out and graduate in eight years, and while you're at it possibly take a swipe at that new Italian breezey who just entered the neuroscience program. Donate first, worry about those problems later.
3) We got another performance for you all this November, including Schumann's Adagio and Allegro for cello and piano, Resphigi's Adagio con Variazioni, and the Debussy cello sonata. Time and location TBA. Also, more music videos will be uploaded soon, but while you're waiting, you can listen to the latest Mozart Fantasie in D Minor, which has proved one of my most popular videos to date; last I checked, it had 57 views, which I think qualifies for viral status. We goin' worldwide, baby! World-WIDE!!
4) AFNI tutorials are next on the docket, after wrapping up the intro Unix tutorials for neuroimagers, and possibly doing a couple more FSL tutorials on featquery, FSL's ROI analysis tool. Beyond that, there isn't much else I have to say about it; now that you've mastered the basics, you should be able to get the program to jump through whatever hoops you set up for it and to do whatever else you need. There are more complex and sophisticated tools in FSL, to be sure, but that isn't my focus; I will, on the other hand, be going into quite a lot of details with AFNI, including how to run functional connectivity and MVPA analyses. It will take time, but we will get there; as with the FSL tutorials, I'll start from the bottom up.
Anyway, the latest Unix tutorial covers the basics on shells and variables. Shells are just ways of interfacing with the Unix OS; different shells, such as the t-shell (tcsh) and bash shell, do the same thing, but have different syntax and different nomenclature for how they execute commands. So, for example, an if/else statement in the t-shell looks different from a similar statement in the bash shell.
Overall, there's no need to worry too much about which shell you use, although AFNI's default is tcsh, so you may want to get yourself used to that before doing too much with AFNI. I myself use tcsh virtually all of the time, except for a few instances where bash is the only tool that works for the job (running processes on IU's supercomputer, Quarry, comes to mind). There are lots of tcsh haters out there for reasons that are beyond me, but for everything that I do, it works just fine.
As for variables, this is one of the first things you get taught in any intro computer science class, and those of you who have used other software packages, such as R or Matlab, already know what a variable is. In a nutshell, a variable is a thing that has a value. The value can be a string, or a letter, or a number, or pretty much anything. So, for example, when I type in the command
set x=10in the t-shell, the variable is x, and the value is now 10. If I wish to extract the value from x at any time, I prepend a dollar sign ('$') to it, in order to tell Unix that what follows is a variable. You can also use the 'echo' command to dump the value of the variable to the standard output (i.e., your terminal). So, typing
echo $xreturns the following:
10which is the value that I assigned to x.
From there, you can build up more complicated scripts and, by having the variable as a placeholder in various locations in your script, only have to change the value assigned to it in order to change the value in each of those locations. It makes your programming more flexible and easier to read and understand, and is critical to know if you wish to make sense of the example scripts generated by AFNI's "uber" scripts.
With all of the tutorials so far, you have essentially all of the fundamentals you need to operate FSL. Really, you only need to understand how to open up a terminal and make sure your path is pointing to the FSL binaries, but after that, all you need to do is understand the interface, and you can get by with pointing and clicking. However, a more sophisticated understanding is needed for AFNI, which will be covered soon. Very soon. Patience, my pretties.
Labels:
AFNI,
bash,
cello,
debussy,
fantasie in d minor,
FSL,
functional connectivity,
mozart,
neuroimaging,
resphigi,
schumann,
scripting,
tcsh,
tutorials,
Unix
Saturday, August 18, 2012
Unix for Neuroimagers (Part 1): Fundamentals
As promised, we have begun a new series of tutorials aimed at the beginning neuroimager, who may think that he can get by without learning any computer science whatsoever. This is, unfortunately, not true, and those who wish to pursue a career in cognitive neuroscience need to at least learn the fundamentals; if not for constructing your own scripts, then at least for being able to understand and interpret what others have done. Those who refuse to go beyond their comfort zone and test the waters of what must seem to them a foreign and unfriendly language, will forever be relegated to pushing the Big Button that executes commands or scripts without really knowing what is going on. To enter this field without a working knowledge of programming is to be partially blind.
To that end, these first few screencasts will guide the beginner over the initial hurdles of navigating their computer environment solely through the command line interface. At the basic level of navigation and file manipulation, some simple analogies can be drawn between typing in commands such as cd and ls, and pointing and clicking within the standard Windows or Macintosh operating systems that most people are used to. However, at the more abstract levels involving if/else statements and for loops, there are no ready analogies I can think of, and at this point the Unix shell must be treated as any other foreign language; the only way to learn it is by doing, and by consistent repetition.
Usually I try to supplement the videos with some written commentary, but in this case, I believe that there is a very good introductory resource already out there, which can be found here. Walking through all of these tutorials will probably take less than an hour, but it is worth coming back to them from time to time to reinforce what you have learned.
For those of you who are new to neuroimaging or programming and may doubt whether it will ever really stick, let me assure you that it will, in time. Five years ago I was engaged in a research project the summer of my senior year; however, I knew nothing about computer programming. Nothing. I had taken a class of Java in high school, but barely managed to scrape by with a B-, and that was with copying all of the homeworks from one of the Asian kids in the class under threat of death. I was so useless, I didn't even know how to use Excel (no lie), and needed my advisor to hold my hand through doing the most basic analyses in SPSS. It was humiliating at first, because I knew that many of my colleagues were well versed in all of these tools which appeared as second nature to them, and I felt as though they looked down upon me as some hateful and nasty piece of filth clinging to the soles of their shoes.
However, over time I came to teach myself, more through necessity than anything else. My first job out of college required the use of Unix, the experience with which I greatly exaggerated to a ridiculous degree in my application (I had skimmed through a 1980 Unix textbook borrowed from the public library, and said that I had "experience" with Unix); and I set about to learn whatever I could and whatever I saw was most needed. What I found was that, out of the vast Pacific of commands and options present in Unix, only a minuscule fraction of them were required to successfully carry out the work that I needed to do. More important was molding my mind to accommodate the language and understand how to think through operations before translating my will into a series of typed commands. If I, who had virtually no programming background, a terrible memory, and the attention span of a bag full of puppies, could learn the basics within a year, then so can you. Persist.
| This could be you! |
There is no need to go it entirely alone. As with any skill, much of the fruits of your labors and lightning flashes of insight will only come through long and solitary hours of study and practice; however, it is as important to learn how to identify external resources, whether they float within the ether of the Internet or are made incarnate in the large, stinking, fleshy pile of humanity which sits next to you in your laboratory. One particularly useful resource I have found is unix.com, a message board related to all things Unix. More than once have I posted problems which I had been breaking my head against for many hours or days, only to have a complete solution posted within a matter of seconds. As long as you are willing to tolerate a little condescension and can put up with some invisible nerdling berating you for sloppy indentation, you should be able to solve most of your problems quite easily.
Good luck, comrade.
Subscribe to:
Posts (Atom)


