
Optseq, a tool developed by the good people over at MGH, helps the user order the presentation of experimental conditions or stimuli in order to optimize the estimation of beta weights for a given condition or a given contrast. By providing a list of the experimental conditions, the length of the experiment, the TR, and how long and how frequent the experimental conditions last, optseq will generate schedules of stimuli presentation that maximizes the power of the design, both through reducing variance due to noise and increasing the efficiency of estimating beta weights. This is especially important in event-related designs, which are discussed in greater detail below.
Chapter 1: Slow Event-Related Designs
Slow event-related designs refer to experimental paradigms in which the hemodynamic response function (HRF) for a given condition does not overlap with another condition's HRF. For example, let us say that we have an experiment in which IAPS photos are presented to the subject at certain intervals. Let us also say that there are three classes of photos (or conditions): 1) Disgusting pictures (DisgustingPic); 2) Attractive pictures (AttractivePic); and neutral pictures (NeutralPic). The order in which these pictures are presented will be at a long enough time interval so that the HRFs do not overlap, as shown in the following figure (Note: All of the following figures are taken from the AFNI website; all credit and honor is theirs. They may find these later and try to sue me, but that is a risk I am willing to take):

The interstimulus time interval (ITI) in this example is 15 seconds, allowing enough time for the entire HRF to rise and decay, and therefore allow the experimenter to estimate a beta weight for each condition individually without worrying about overlap in the HRFs. (The typical duration of an HRF, from onset to decay back to baseline, is roughly 12 seconds, with a long period of undershoot and recovery thereafter). However, slow event-related designs suffer from relatively long experimental durations, since the time after each stimulus presentation has to allow enough time for the HRF to decay to baseline levels of activity. Furthermore, the subject may become bored after such lengthy "null" periods, and may develop strategies (aka, "sets") when the timing is too predictable. Therefore, quicker stimulus presentation is desirable, even if it leads to overlap in the conditions's HRFs.
Chapter 2: Rapid (or Fast) Event-Related Designs
Rapid event-related designs refer to experimental paradigms in which the ISI between conditions is short enough so that the hemodynamic response function (HRF) for a given condition overlaps with another condition's HRF. Theoretically, given the assumption of linearity of overlapping HRFs, this shouldn't be a problem, and the contribution of each condition's HRF can be determined through a process known as deconvolution. However, this can be an issue when the ISI's are fixed and the presentation of stimuli is fixed as well:
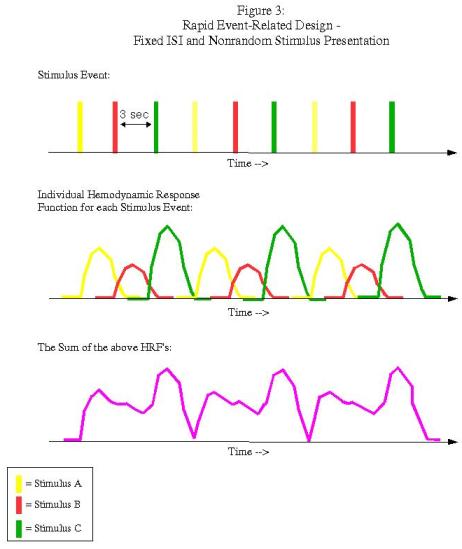
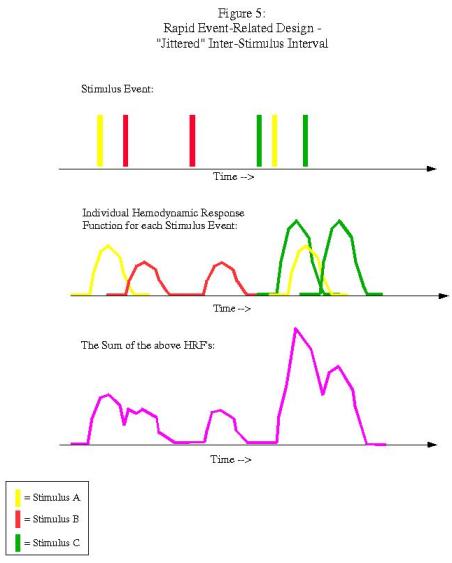
In this example, each condition follows the other in a fixed pattern: A followed by B followed by C. However, the resulting signal arising from the combination of HRFs (shown in purple in the bottom graph) is impossible to disentangle; we have no way of knowing, at any given time point, what amount of the signal is due to condition A, B, or C. In order to resolve this, we must randomize the presentation of the stimuli and also the duration of the ISI's (a process known as "jittering"):
Chapter 3: Optseq
In order to use optseq, first download the software from the MGH website (or, just google "optseq" and click on the first hit that comes up). Put the shell script into a folder somewhere in your path (such as ~/abin, if you have already downloaded AFNI) so that it will execute from anywhere within the shell. After you have done this you may also want to type "rehash" at the command line in order to update the paths. Then, type "optseq2" to test whether the program executes or not (if it does, you should get the help output, which is generated when no argument are given).
Optseq needs four pieces of information: 1) The number of time points in a block of your experiment; 2) The TR; 3) A permissible range of the minimum and maximum amounts of time after presentation of a stimulus and the start of the next (aka, the post-stimulus delay, or PSD); and 4) How many conditions there are in your experiment, as well as how long they are per trial and how many trials there are per block. Optseq will then generate a series of schedules that randomize the order of the ITI's and the stimuli in order to find the maximum design efficiency.
Using the IAPS photos example above, let us also assume that there are: 1) 160 time points in the experiment; 2) a TR of 2 seconds; 3) A post-stimulus window of 20 seconds to capture the hemodynamic response; 3) Jitters ranging from 2 to 8 seconds; and 4) The three conditions mentioned above, each last 2 seconds per trial, and with 20 instances of DisgustingPic, 15 instances of AttractivePic, and 30 instances of NeutralPic. Furthermore, let us say that we wish to keep the top three schedules generated by optseq, each prefixed by the word IAPS, and that we want to randomly generate 1000 schedules.
Lastly, let us say that we are interested in a specific contrast - for example, calculating the difference in activation between the conditions disgustingPic and attractivePic.
In order to do this, we would type the following:
optseq2 --ntp 160 --tr 2 --psdwin 0 20 2 --ev disgustingPic 2 20 --ev attractivePic 2 15 --ev neutalPic 2 30 --evc 1 -1 0 --nkeep 3 --o IAPS --tnullmin 2 --tnullmax 8 --nsearch 1000
This will generate stimuli presentation schedules and only keep the top three; examples of these schedules, as well as an overview of how the efficiencies are calculated, can be seen in the video.
Chapter 4: The Reckoning - Comparison of optseq to 1d_tool.py
Optseq is a great tool for generating templates for stimuli presentation. However, if only one schedule is generated and applied to all blocks and all subjects, there is the potential for ordering effects to be confounded with your design, however minimal that possibility may be. If optseq is used, I recommend that a unique schedule be generated for each block, and then counterbalance or randomize those blocks across subjects. Furthermore, you may also want to consider randomly sampling the stimuli and ITI's and simulate several runs of your experiment, and then run them through AFNI's 1d_tool.py in order to see how efficient they are. With a working knowledge of optseq and 1d_tool.py, in addition to a steady diet of HotPockets slathered with Nutella, you shall soon become invincible.
You shall be...Perfect.
My imperfect understanding is that the efficiency optseq optimizes refers to an FIR-type estimation of the shape/timecourse of your response, when if fact most people are interested in detection efficiency for a contrast of interest. My further imperfect understanding is that optseq-style efficiency actually HURTS constrast/detection efficiency. So the question is not should you optimize your design, but rather are you hurting yourself by using optseq, if your interest is in detection/contrast efficiency? If correct, this seems like an important caveat to raise here.
ReplyDeleteHi Anonymous,
ReplyDeleteYou are correct that optimizing efficiency in estimating beta weights for each condition does not imply efficient contrast estimation; however, you can use the --evc option to optimize one or more contrasts. (I mentioned this in the video, but not in the post; I will fix that.)
Thanks for raising this important issue!
-Andy
Hi Andy,
DeleteI'm a beginner Optseq user, and I'm trying to optimise multiple contrasts.
In your post above you suggest that this is possible.
However, ran Optseq2 asking it to generate also the "summary" file as output using the option --sum . After completion, this file contains a line which says:
EV Contrast: 1.000 -1.000 -1.000 1.000 0.000
and then, no other contrast is listed.
This happens to be the *LAST* of the (eight) contrasts that I specified and would like to optimise.
How can we be sure that Optseq2 optimizes *ALL* of the contrasts, and not just the last one??
Many thanks in advance,
Max
Hey Max,
DeleteApologies for the late reply - you would think that optseq could optimize multiple contrasts and not just one, but according to an email exchange between a user and Doug Greve (the creator of optseq), this is not possible.
I'm not positive what the tradeoff is when optimizing one contrast at the expense of the rest, and whether this leads to huge differences compared to merely using optseq to optimize the beta weights.
-Andy
Thanks Andy - This is a huge help. I'm having trouble figuring out how to model a more involved design...wondering if you have any insights:
ReplyDeleteI have two conditions (milkshake and water).
Participants get a squirt of milkshake (4s) then swallow (jittered?) then a rinse of water (no interest) then swallow (jitter again?).
In the other condition, they just get a squirt of water and a swallow.
In order to model all of this, would I need to put in every event that's taking up time as an event, and then just do an event contrast comparing the two conditions of interest?
Or would I make the "events" be long enough to encompass all the actions that are taking place during that event (even though I'm just interested in the first 4s when the person is receiving a taste)?
Hey John,
DeleteYes, you would need to model any events you are interested in for a contrast. In AFNI, any events you don't model are automatically put into the baseline model (which, for the F-statistics usually generated by AFNI, can be thought of as a null hypothesis model).
When you ask about making the events long enough, are you talking about making a duration regressor as long as the entire condition? I would try to avoid that, as it would be difficult to determine what exactly is leading to the differences between the conditions. Furthermore, from your design it looks like one condition is longer than the other, which could potentially be a confound.
Also, in case you were asking about the jitters, it looks fine to me where you have them right now. If you were modeling over the duration of the entire condition then they wouldn't matter as much, but if you are looking at each condition separately, you will need the jitters to be able to estimate any parameters associated with those events.
Hope this helps!
-Andy
Thanks, Andy - very helpful.
ReplyDeleteVery helpful blog, thanks! I am trying to figure out what the efficiency numbers mean. I can see that higher numbers are "better", but is there a heuristic for what range this should be in? For example, one study of mine yielded values near .11, another near .58, and your example has values near 1.x. I am wondering if low values warrant changing the design e.g., number of conditions.
ReplyDeleteHi Anonymous,
DeleteFrom what I can tell, the efficiency estimates do not have any magnitude associated with them, but rather are relative measures; in other words, you could try a few different designs and timing schedules, and then see which one is more efficient than the other. Also remember that efficiency is only one slice of the pie; you should also take into account the trial yield for each design and how amenable it will be to the subjects, among other factors.
All that aside, the short answer is that efficiency is relative - all things being equal, choose the design with the highest efficiency. Just because someone else's design for a completely different type of experiment has better efficiency for their regressors does not mean that their experiment is necessarily better; it's all relative. And that's a good thing. I think.
Hope this helps,
-Andy
Thanks, Andy.
DeleteHi Andy,
ReplyDeleteI'm a beginner Optseq user, and I'm trying to optimise multiple contrasts.
In your post above (dated October 2, 2012) you suggest that this is possible.
However, I ran Optseq2 asking it to generate also the "summary" file as output using the option --sum . After completion, this file contains a line which says:
EV Contrast: 1.000 -1.000 -1.000 1.000 0.000
and then, no other contrast is listed.
This happens to be the *LAST* of the (eight) contrasts that I specified and would like to optimise.
How can we be sure that Optseq2 optimizes *ALL* of the contrasts, and not just the last one??
Many thanks in advance,
Max
Hi Andy,
ReplyDeleteWhen I identify the min null duration as 2 seconds I still get few trials with null duration= 0. Do you have any suggestions for how I can fix this problem?
Hey there, can you post the code you used for the optseq command? I haven't used optseq in a while, but maybe I can spot the problem.
Delete-Andy
Hello,
ReplyDeleteI'm a little confused about what determines the length of the "NULL" periods in the schedules generated by optseq. Originally, I thought you could set these parameters through the min/max PSD, but when I did so I got an output with a few NULL trials longer than the 8 second PSD max that I set. Here's the code I used:
optseq2 --ntp 420 --tr 2 --psdwin 2 8 2 --ev OFR 8 8 --ev OFI 8 8 --ev ONR 8 8 --ev ONI 8 8 --ev new 8 32 --ev different 8 8 --ev same 8 8 --evc 0.25 0.25 0.25 0.25 1 0 0 --nkeep 3 --o OSC_new --nsearch 1000
Some googling told me that one can also add --tnullmin and --tnullmax to the code, so now I'm also confused about the difference between PSD and the length of the "NULL" periods.
Any help would be appreciated, thank you in advance!
I wonder the same thing!
DeleteDear Andy
ReplyDeleteThank you for the insightful post
An embarrassingly technical question - I'm trying to run optseq2 using cygwin (default instillation) and just can't seem to run it correctly
I've added the directory to the PATH (and verified using which)
ran chmod a+x optseq2
and nothing - is there something basic I'm missing?
Hi there,
DeleteWhat kind of error are you getting? I've found that sometimes you need to run chmod 777 optseq2 to get it to work. If that doesn't fix it, I'm not sure what it is; it might be something specific to Cygwin.
Good luck!
-Andy
Hi Andy
ReplyDeleteThanks for your suggestion.
No matter what I did Cygwin just wouldn't run Optseq
I switched to Ubuntu + virtual box and it worked perfectly
Best,
Greg
Good to know! Maybe Cygwin just doesn't work with Optseq.
Delete-Andy
Dear Andy,
ReplyDeletethank you for your very useful post. My question regards using optseq2 with two levels of events - one to be optimized but not randomized (encoding always followed by recognition, but with jittered ISI) and second: optimized and randomized (3 types of stimuli to be encoded and recognized). Is it possible to do it with optseq?
Best regards,
Barbara
I'm desperately looking for optseq2 but the file I downloaded on the official website seems to be corrupted.
ReplyDeleteDoes anyone could send it to me, please ? (I'm on Mac)
Alex
Hi Alex,
DeleteHow is it corrupted? Is it just not running? In that case, I've found that it is usually because of permission settings. Try going to the directory where optseq2 is located and doing chmod 755 optseq2.
-Andy
Hi Andy,
DeleteI finally found a way to obtain optseq2: I downloaded freesurfer...
Hi Andy, thanks for the information on this. Would it be correct to say that you cannot enter both multiple events and multiple conditions per event in optseq when defining your design? For the task I am using, each trial has 3 events. The first two events have 4 levels each, the second has two levels. I'm interested in what ISI ranges I should use between the events. I do plan to jitter.
ReplyDelete-Jennifer
Greetings,
ReplyDeleteHas anyone found an easy way (relatively) to show the results in a .par file graphically?
Cheers,
Jason
Hey Jason, try a program such as AFNI's 1dplot; it's easy to use, and has a -sepscl option to present each regressor on its own scale.
Delete-Andy
Greetings,
ReplyDeleteI've tried but cannot figure out how to use optseq2 to develop a schedule with the following parameters: TR=2.5sec, stimulus presentation time 1second or less. Does anyone have any suggestions?
Cheers,
Jason
Hey Jason, optseq will restrict you to a tr that is a multiple of your event duration; so, you could have a tr of 2.5 seconds and an event duration of 0.5 seconds, but not a tr of 2.5 seconds and an event duration of 1 second.
DeleteAlso make sure that the dPSD is a multiple of your event duration. E.g.:
optseq2 --tprescan -6 --ntp 100 --tr 2.5 --psdwin 0 20 0.5 --ev evt1 0.5 30 --ev evt2 0.5 30 --nkeep 3 --o ex3 --nsearch 10000
-Andy
Hi! I'm sorry but I don't understand whythe dPSD need to be a multiple of the event duration? It's kind of hard to fullfil that if you have event durations of the order of 20 seconds, since the TR also needs to be an muliple of the dPSD which means event duration < dPSD < TR.
DeleteThanks!
Olaf
Greetings,
ReplyDeleteI am using optseq2 to estimate fMRI runs and cannot figure out how to get optseq2 to make at least the first time period in the schedule to be a null event. Does anyone know how to accomplish this task?
Cheers,
Jason
Hi Jason,
DeleteTry using the --tprescan option, and setting it to a negative number. For example, if I want the first event to occur six seconds after scanning starts, then I could use a command like the following:
optseq2 --tprescan -6 --ntp 100 --tr 2 --psdwin 0 20 --ev evt1 2 30 --ev evt2 2 30 --nkeep 3 --o ex3 --nsearch 10000
Best,
-Andy
Hi,
DeleteUsing a negative number for --tprescan caused a spectacular fail for me (macOS):
optseq2 --tprescan -1 --tnullmin 1 --ntp 1800 --tr 1 --psdwin 0 20 --ev a 4 16 --ev b 4 16 --ev c 4 16 --ev d 4 16 --ev e 4 16 --ev f 4 16 --ev g 4 16 --ev h 4 16 --ev i 4 16 --ev j 4 16 --nkeep 30 --o FDMT --nsearch 1000
INFO: Setting srand48() seed to 963450
optseq2
$Id: optseq2.c,v 2.15 2009/05/26 18:13:45 greve Exp $
NoSearch = 0
nSearch = 1000
nKeep = 30
PctUpdate = 10.000000
nCB1Opt = 0
seed = 963450
Ntp = 1800
TR = 1
TPreScan = -1
PSD Window = 0 20 1
nEvTypes = 10
EvNo Label Duration nRepsNom
1 a 4.000 16
2 b 4.000 16
3 c 4.000 16
4 d 4.000 16
5 e 4.000 16
6 f 4.000 16
7 g 4.000 16
8 h 4.000 16
9 i 4.000 16
10 j 4.000 16
PctVarEvReps = 0
VarEvRepsPerCond = 0
PolyOrder = -1
tNullMax = -1
tNullMin = 1
outstem = FDMT
AR1 = 0
No refractory penalty
Cost = eff
OutStem = FDMT
Summary File = FDMT.sum
nTaskAvgs = 200
INFO: LogFile is FDMT.log
outstem = FDMT
0 7 0.0 0.0721536 0.0721536 0.6538 14.4367 0.293691 13.625 15.3177 1.69273 6550.52 0
/usr/pubsw/packages/vxl/1.9.0/src/core/vnl/algo/vnl_qr.txx: vnl_qr::solve() : matrix is rank-deficient by 91
/usr/pubsw/packages/vxl/1.9.0/src/core/vnl/algo/vnl_qr.txx: vnl_qr::solve() : matrix is rank-deficient by 91
/usr/pubsw/packages/vxl/1.9.0/src/core/vnl/algo/vnl_qr.txx: vnl_qr::solve() : matrix is rank-deficient by 91
/usr/pubsw/packages/vxl/1.9.0/src/core/vnl/algo/vnl_qr.txx: vnl_qr::solve() : matrix is rank-deficient by 91
/usr/pubsw/packages/vxl/1.9.0/src/core/vnl/algo/vnl_qr.txx: vnl_qr::solve() : matrix is rank-deficient by 91
/usr/pubsw/packages/vxl/1.9.0/src/core/vnl/algo/vnl_qr.txx: vnl_qr::solve() : matrix is rank-deficient by 91
/usr/pubsw/packages/vxl/1.9.0/src/core/vnl/algo/vnl_qr.txx: vnl_qr::solve() : matrix is rank-deficient by 91
It could be because I have multiple events? Or some other gremlin.
Fortunately, if you just want an offset at the beginning of your experiment all you'd need to do is add an offset (e.g. 12 sec) to all the onset times provided by optseq. One thing to note is that you should probably use an offset that is a multiple of your TR (e.g. 4 * TR3s = 12sec) to avoid messing up the jittering that optseq has introduced.
Cheers, Jon
Hi Andy
ReplyDeleteI have a question about jittering. Is it a big problem to jitter the length of events rather than the ISI between the events? Here is an example of this type of design:
http://journals.plos.org/plosbiology/article?id=10.1371/journal.pbio.1001684
The reason I am interested in this is that it allows me to separate the events that I am interested in without having to include lots of ISI's between events. This way I can include more trials. Plus subjects won't have their working memories strained too much.
I have tried to find more info on this type of design but to no avail, so any guidance on this would be great!
Thanks
David
Hi David,
DeleteBoth methods do the same thing: Vary the onset of different trials relative to each other, so that different points of the HRF are sampled for each condition. But why add the extra time to your condition when you can assign that time to an ISI? I can see how it might reduce working memory demands, but I don't see how it allows you to add more trials.
Also keep in mind that longer durations can lead to BOLD effects that may not be captured by simply using duration regressors. This all depends on your experimental design: Is there any reason to believe that the longer presentation of a stimulus (or cognitive process) would interact with any of the other conditions, as opposed to keeping everything the same? I don't have any examples at hand of how this might happen, but it's something to keep in mind.
-Andy
That's good to know. Thanks very much, Andy. I can shave off a few seconds in each trial by getting rid of the ISI and incorporating the jitter into the event. For example, an event of 2s plus a jitter averaging 3.5s (av length 5.5s) is longer that just the jittered event (av length 3.5). Considering that I want to do this twice within each trial, this should give me considerably more room across the whole task to play with.
DeleteI am a bit concerned about the effect of the variable lengths but I'm given some confidence by the fact that the same kind of task has been done like this in the previous literature.
Once again, thanks a lot for your advice :)
David
Hi Andy, Thanks so much for your incredibly useful blog and videos!
ReplyDeleteI have a question about optseq2. I am looking for a jitter of between 0.5 and 4 secs to be generated. Thus my command was
optseq2 --ntp 300 --tr 2 --psdwin 0 4 .5 --ev common 2 42 --ev rare 2 18 --o Aliens3_outstem --nsearch 10000 --nkeep 4.
However, it ends up generating ITIs of from 0.5 up to 32! Any idea why it would do this?
Thanks,
Maria
Hey Maria,
Deletepsdwin actually is to capture the full range of the hemodynamic response (which can be from about 20 to 30 seconds, depending on if you want to capture the undershoot as well). If you want to limit the range of jitters, you can use the options --tnullmin and --tnullmax. Note that you will need to have enough trials to make sure the jitters stay within a certain range; else, the extra time will be filled up with longer jitters.
-Andy
Hi Andy,
DeleteCan you clear up some confusion I have with optseq? When you specify the psdwin with 0 and 4 (as above) I take this to mean that you are implying that the BOLD signal associated with an event will last (on average) between 0 and 4 seconds from the onset of a single event? I understand that this is more related to BOLD modelling than considerations for jittering (although the two are intertwined), the question I have is about the 0.5 at the end of Maria's psdwin argument, what purpose does this serve? Shouldn't this always be equal to the TR? Any help getting to grips with this would be much appreciated!
Cheers, Jon
Hi, Andy. I downloaded the OptSeq2.txt (the Linux version) from the website, and set the path on Ubuntu 16.04, but it can't work. When I typed 'nano OptSeq2', to read the txt file, found that it displays messy code. And then, I open the txt file on the windows and the mac, also messy code...
ReplyDeleteI wonder what's wrong with it? I also tried to download some other package, like r, the txt file is well, no messy code. Do you have the intact OptSeq2.txt file for the Linux Ubuntu 16.04, and send to my email (jieyinfeng0505@gmail.com) ? Or is it a problem, that I didn't install the FreeSurfer, or I need a license??
Hey there,
DeleteI don't think it's a problem with installing Freesurfer; you should be able to use optseq on its own. What happens when you type "./optseq2" from the directory where the file is located?
I'll send you the file over email, but my guess is that it's some kind of path issue.
Best,
-Andy
Yap! It's a path issue. I asked Ubuntu, and fixed it. Thx. for your email and answer~~
Deletehello, Andy
ReplyDeleteI now have a question about the focb setting (first order counter-balancing)
in the current study, I have 3 modalities, and each modal have 4 conditions. So it turns out 12 conditions in total.
and if I random 12 events in the OptSeq2, it is easy to have a problem, like, the continuous trials presented in the same modal. But for the brain signal, I would rather to randomize the order of both the conditions and the modalities.
here, my question is, if the focb can fix that problem?
if It can, so could I use the self-designed matrix for the sequence? cuz I read a Q&A in the mail list of FreeSurfer (see the last response by Doug, https://mail.nmr.mgh.harvard.edu/pipermail//freesurfer/2013-June/030954.html), what it described is not as what I understood.
or if it cannot, is it any other parameter I can use in OptSeq2?
Thanks
Hi Jieyin,
DeleteI'm not sure whether first-order counter-balancing can fix that problem; from what I understand, focb will counter-balance all of the conditions, but not necessarily counter-balance the factors. If you think this will lead to some kind of ordering effect, write to the FreeSurfer listserv and see what they say.
-Andy
This comment has been removed by the author.
ReplyDeleteHi Andy, thank you for this helpful post! I am wondering what if there are different stages within a trial and I want to model them separately? For example, I am playing a video of one of the finger being touched in each trial, and the videos have this timeline: 0~2 sec:just show a hand, 2~2.5 sec:a stick is approaching, 2.5~3.5 sec:one of the fingers is touched by the stick, 3.5~4 sec:the stick is withdrawing, 4~6 sec:just show a hand again. The critical event that differentiates experimental conditions is when a finger is touched, but obviously I need to model separately when there is just a hand, when the stick is approaching, etc. How do I setup inputs for Optseq2 in this case?
ReplyDeleteThank you!
Yuqi
Hi Andy,
ReplyDeleteI hope you are doing well. I am currently an undergrad working on some fMRI stuff, and I am tasked with getting optseq to run. I have it downloaded on a mac, and I have it installed. But unfortunately, I do not know how to run it. Can you please tell me how I should?
Thank you so much,
John
Hi Andy,
ReplyDeleteThis is a very late comment, but I was wondering if you could tell me how to program the schedule you generate with optseq into Eprime. In other words, how do I tell my program in e-prime that I want to use the stimulus schedule that I created with optseq?
Any tips?
Hi Mackenzie,
DeleteYou will have to code it by hand; you can't directly import the schedules into E-Prime. There are ways to read text files into List objects, but they need to be formatted a specific way first.
-Andy
Hi Andy, so sorry to ask, but do you think you could send me the optseq2 installer? I see you've kindly offered to send things to others here... I've tried several times over the past couple weeks and their website seems to be down. Thanks!
ReplyDeleteHi Andy, thanks for this blog post- I reference it often when making my scan program for our group's studies. Quick question- if we needed more jitter output times, we'd increase the "ntp", right? Are other other variables that we can/should change too?
ReplyDeleteThis comment has been removed by the author.
ReplyDeleteHi Andy,
ReplyDeleteI am a great fan of your blog! If you could help me with this one that would be super cool:
I have a design with 3 by 3 conditions (Go/ No-Go / BL and emotion: negative, neutral, positive).
I don't want to have too many trials of the same emotion and not too many trials of the same Go/NoGo type in a row. I also would like to balance them in terms of average serial position (I want to avoid for example having mostly positive trials at the start and then later only negative and neutral trials). On top of that I want to make sure, that each condition (e.g. neutral No-Go) precedes all other eight conditions to a roughly equal amount within one run.
Can Optseq helo me with this?
Is there an alternative to Optseq?
What would you do?
Thank you very much for any advice!
Hi Andy, thank you for your descriptions, it has been very helpful. I have a question about the output though. (For ease, I ran your quick code for optseq2 above.) So, the nkeep = 3 but I am only getting 1 output (i.e IAPS-001). In addition to this my .par and .sum files are empty and cannot be read. Considering I followed everything to the t and literally copied your code to debug, I am wondering if my system is too new to run optseq adequately. Let me know what you think if you have time. Thanks!
ReplyDeleteInput:
optseq2 --ntp 160 --tr 2 --psdwin 0 20 2 --ev disgustingPic 2 20 --ev attractivePic 2 15 --ev neutalPic 2 30 --evc 1 -1 0 --nkeep 3 --o IAPS --tnullmin 2 --tnullmax 8 --nsearch 1000
Output:
INFO: Setting srand48() seed to 490520
optseq2
$Id: optseq2.c,v 2.14 2008/03/10 13:35:23 nicks Exp $
NoSearch = 0
nSearch = 1000
nKeep = 3
PctUpdate = 10.000000
nCB1Opt = 0
seed = 490520
Ntp = 160
TR = 2
TPreScan = 0
PSD Window = 0 20 2
nEvTypes = 3
EvNo Label Duration nRepsNom
1 disgustingPic 2.000 20
2 attractivePic 2.000 15
3 neutalPic 2.000 30
PctVarEvReps = 0
VarEvRepsPerCond = 0
PolyOrder = -1
tNullMax = 8
tNullMin = 2
outstem = IAPS
AR1 = 0
No refractory penalty
Cost = eff
OutStem = IAPS
Summary File = IAPS.sum
nTaskAvgs = 30
C Contrast Matrix ---------------------- (I deleted this part since it was long, but a bunch of 0.00, 1.00, and -1.00)
================== ----------------------
INFO: LogFile is IAPS.log
outstem = IAPS
And then what I have saved are these 4 files: IAPS (text doc 0KB), IAPS.sum (SUM file 0KB), IAPS.xtxideal (excel file/MATLAB 8KB), and IAPS-001.par (PAR file 0KB)
Hi Andy,
ReplyDeleteCould you please elaborate on the output. For example, does your output suggest presenting stimuli in the following order with the following timing: DisgustingPic for 2s, DisgustingPic for 2s, neutralPic for 2s, DisgustingPic for 2s, nothing for 2s, neutralPic for 2s, nothing for 6s... This interpretation seems wrong to me, since that would mean there is no ITI between the first and second DisgustingPic. Am I understanding this wrong? Could you please clarify!
Also, thank you for your blog. It is one of the only useful resources on optseq.
Best,
Ekaterina
Question, other than searching and selecting within the optseq output par files, is there a way to alter optseq2 to limit the repeats of a certain trial type to for example 3 in a row. Basically, I need an optimized pseudo-random sequence. thanks!
ReplyDelete