However, the majority of studies are not resting-state experiments, but instead have participants perform a wide variety of interesting tasks, such as estimating how much a luxury car costs while surrounded by blonde supermodels with cleavages so ample you could lose a backhoe in there. If the participant is close enough to the actual price without going over, then he -
No, wait! Sorry, I was describing The Price is Right. The actual things participants do in FMRI experiments are much more bizarre, involving tasks such as listening to whales mate with each other*, or learning associations between receiving painful electrical shocks and pictures of different-colored shades of earwax. And, worst of all, they aren't even surrounded by buxom supermodels while inside the scanner**.
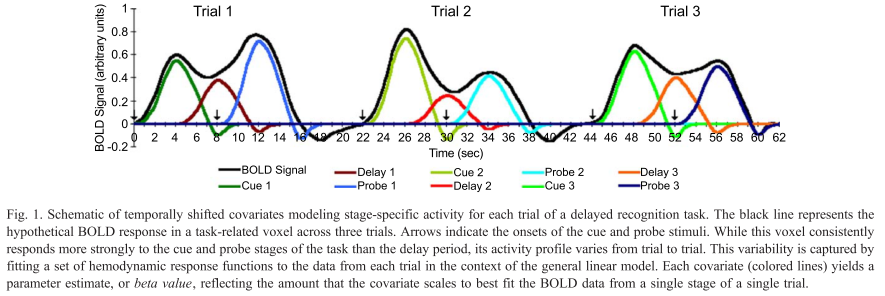
In any case, these studies can attempt to ask the same questions raised by resting-state experiments: Whether there is any sort of functional correlation between different voxels within different conditions. However, traditional analyses which average beta estimates across all trials in a condition cannot answer this, since any variance in that condition is lost after averaging all of the individual betas together.
Beta series analysis (Rissman, Gazzaley, & D'Esposito, 2004), on the other hand, is interested in the trial-by-trial variability for each condition, under the assumption that voxels which show a similar pattern of individual trial estimates over time are interacting with each other. This is the same concept that we used for correlating timecourses of BOLD activity while a participant was at rest; all we are doing now is applying it to statistical maps where the timecourse is instead a concatenated series of betas.
The first step to do this is to put each individual trial into your model; which, mercifully, is easy to do with AFNI. Instead of using the -stim_times option that one normally uses, instead use -stim_times_IM, which will generate a beta for each individual trial for that condition. A similar process can be done in SPM and FSL, but as far as I know, each trial has to be coded and entered separately, which can take a long time; there are ways to code around this, but they are more complicated.
Assuming that you have run your 3dDeconvolve script with the -stim_times_IM option, however, you should now have each individual beta for that condition output into your statistics dataset. The last preparation step is to extract them with a backhoe, or - if you have somehow lost yours - with a tool such as 3dbucket, which can easily extract the necessary beta weights (Here I am focusing on beta weights for trials where participants made a button press with their left hand; modify this to reflect which condition you are interested in):
3dbucket -prefix Left_Betas stats.s204+tlrc'[15..69(2)]'
As a reminder, the quotations and brackets mean to do a sub-brik selection; the ellipses mean to take those sub-briks between the boundaries specified; and the 2 in parentheses means to extract every other beta weight, since these statistics are interleaved with T-statistics, which we will want to avoid.
Tomorrow we will finish up how to do this for a single subject. (It's not too late to turn back!)
*Fensterwhacker, D. T. (2011). A Whale of a Night: An Investigation into the Neural Correlates of Listening to Whales Mating. Journal of Mongolian Neuropsychiatry, 2, 113-120.
**Unless you participate in one of my studies, of course.


Spank you very hard
ReplyDeleteHi Andy,
ReplyDeleteWhy did you exclude Left#0_Coef to make Left_Betas?
Thanks
Carelessness! I completely forgot about it. There was no reason to exclude it; apologies for the confusion.
Delete-Andy
Did tomorrow ever happen? I can't find the next steps
ReplyDelete