When performing this type of analysis, therefore, it is important to know how your analysis software processes duration modulation data. With AFNI, the default behavior of their duration modulation basis function (dmBLOCK) used to scale everything to 1, no matter how long the trial lasted. This may be useful for comparison to other conditions which have also been scaled the same way, but is not an appropriate assumption for conditions lasting only a couple of seconds or less. The BOLD response tends to saturate over time when exposed to the same stimulation for an extended period (e.g., block designs repeatedly presenting visual or auditory stimulation), and so it is reasonable to assume that trials lasting only a few hundred milliseconds will have less of a ramping up effect in the BOLD response than trials lasting for several seconds.
The following simulations were generated with AFNI's 3dDeconvolve using a variation of the following command:
3dDeconvolve -nodata 350 1 -polort -1 -num_stimts 1 -stim_times_AM1 q.1D 'dmBLOCK' -x1D stdout: | 1dplot -stdin -thick -thick
Where the file "q.1D" contains the following:
10:1 40:2 70:3 100:4 130:5 160:6 190:7 220:8 250:9 280:30
In AFNI syntax, this means that event 1 started 10 seconds into the experiment, with a duration of 1 second; event 2 started 40 seconds into the experiment with a duration of 2 seconds, and so on.
The 3dDeconvolve command above is a good way to generate simulation data, through the "-nodata" option which tells 3dDeconvolve that there is no functional data to process. The command tells 3dDeconvolve to use dmBLOCK as a basis function, convolving each event with a boxcar function the length of the specified duration.
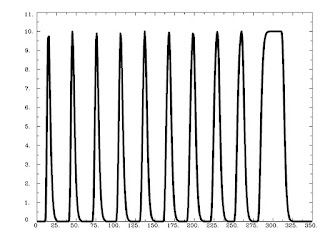
Running this command as is generates the following graph:
As is expected, trials that are shorter are scaled less, while trials lasting longer are scaled more, with a saturation effect occurring around 8-9 seconds.
Running 3dDeconvolve with a basis function scaling the signal change in each to 1 is done with the following:
3dDeconvolve -nodata 350 1 -polort -1 -num_stimts 1 -stim_times_AM1 q.1D 'dmBLOCK(1)' -x1D stdout: | 1dplot -stdin -thick -thick
And generates the following output:
Likewise, the ceiling on the basis function can be set to any arbitrary number, e.g.:
3dDeconvolve -nodata 350 1 -polort -1 -num_stimts 1 -stim_times_AM1 q.1D 'dmBLOCK(10)' -x1D stdout: | 1dplot -stdin -thick -thick
However, the default behavior of AFNI is to scale events differently based on different duration (and functions identically to the basis function dmBLOCK(0)). This type of "tophat" function makes sense, because unlimited signal increase as duration also increases would lead to more and more bloodflow to the brain, which, taken to its logical conclusion, would mean that if you showed someone flashing checkerboards for half an hour straight their head would explode.
As always, it is important to look at your data to see how well your model fits the timecourse of activity in certain areas. While it is reasonable to think that dmBLOCK(0) is the most appropriate basis function to use for duration-related trials, this may not always be the case.
These last two figures show the same subject analyzed with both dmBLOCK(0) and dmBLOCK(1). The underlying beta values for each do not differ significantly, although there is some variability in how much they differ in distinct cortical areas, and small but consistent changes in variability can lead to relatively large effects at the second level.
The image on the left hasn't been masked, but the underlying beta estimates should be the same in either case.
_CuePolicyStats.png) |
| dmBLOCK(0) |
_CuePolicyStats.png) |
| dmBLOCK(1) |


No comments:
Post a Comment